Jean-Daniel Fekete
INRIA Futurs / LRI
Jean-Daniel.Fekete@acm.org
Compus is a visualization system that assists in the exploration and analysis of structured document corpora encoded in XML.
Compus assigns a color to each tag name used in the corpus and display the documents as vertical bars with the colors positioned at the elements position.
By selectign which elements are visible and their specific colors, Compus supports finding of regularities or discrepancies from an homogeneous corpus.
Compus offers several tools to customize the visualization and support visual exploration and data mining: automatic color allocation, visibility selection for elements, various sorting options and structural transformations through XSLT programs.
Selected element sets can be exported as tables for further external treatments by spreadsheet calculators, statistical programs or other visualization systems.
Compus is a program designed to visualize a corpus made of 100 to 500 XML documents sharing a common structure, i.e. a similar DTD. In short, Compus visualizes a mid-size, homogeneous, XML corpus.
It is aimed at helping users find regularities or discrepancies among documents contained in the corpus. It relies on the visual system to notice patterns and irregularities in those pattern, providing a visual "data mining" system.
Compus visualizes elements positions by assigning a color to each element name and displaying these colors on a vertical bar for each document. The assignment of colors and the visibility of elements can be controlled interactively and responds immediately to users modifications, improving searching time and regularities seeking.
XML uses several encoding mechanisms such as attributes and nesting to describe phenomena. Compus cannot visualize directly these phenomena but provides a XSLT processor to apply structural transformations to the original documents. These transformations can turn any encoding mechanism into elements that will be visualized by Compus. These transformations does not modify the original documents and their visualization pane but create another visualization pane, similar to alternative views in database systems.
This document describes the Compus system and shows how to use it effectively to explore an XML corpus. Examples are taken from corpus encoded using the recommendations of the Text Encoding Initiative [TEI] since it has been used mainly in this context. However, Compus is not limited to the TEI DTDs.
Although the potential audience of a program such a Compus is hard to know in advance, Compus has been designed for scholarly research on textual corpora. Researchers relying on a textual corpus encoded in XML and describing several levels of phenomena using various encoding techniques.
The author has been using Compus on various XML/TEI corpora. Compus can also be used on SGML corpora since programs exists (such as[SX]) to automatically convert an SGML document into an equivalent XML document.
We are interested by feedback by other categories of users who would find Compus useful for their own work.
Note the Compus is a work in progress and is a research progress. Don't hesitate to submit any advice or improvement to make it more usable or enhance this documentation.
As a free program, Compus is not officially maintained but improved in a best effort basis by the author. Therefore, don't expect Compus to be reliable, useful, nice looking, well documented. We are still hoping it will be helpful for scholarly studies.
This manual is organized in six chapters in increasing order of sophistication. Chapters 1 through 3 describe simple use of Compus whereas chapter 4 requires the knowledge of the XSLT language. Chapter 5 explains how to export data tables from Compus for further treatments.
Compus is distributed under the GNU General Public Licence.
Compus is currently started by a line of command that launches the application and provides the names of all the XML files to visualize. The display order is then the order in which the file names are provided.
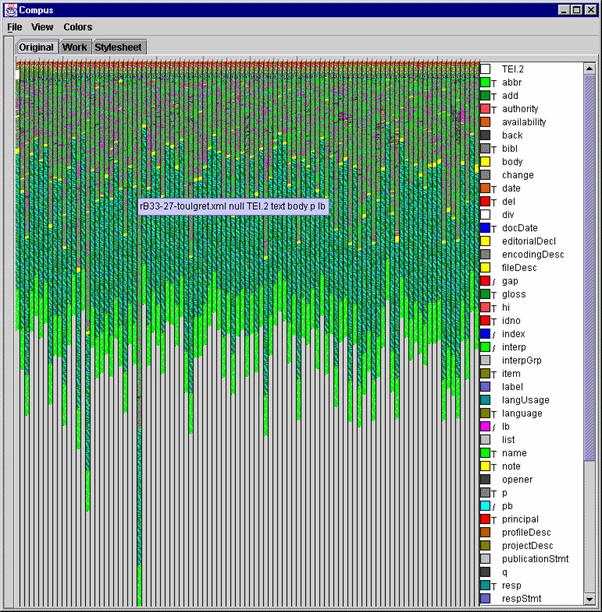
Compus initial layout with 99 XML/TEI documents visualized. Figure 1 shows the main screen resulting from starting Compus with 99 documents from a corpus of TEI encoded files.
Figure 1:Compus initial layout with 99 XML/TEI documents visualized
Four zones can be distinguished: the menu bar, the tab pane, the main pane and a list of element names and color. Three panes can be accessed through the tabbed pane: the visualization of the original documents through the "original" pane. The XML source of a selected document in the "Work" pane and a style sheet describing structural transformations to apply to the source documents in the "Stylesheet" pane. More panes appear when applying a style sheet. Clicking on a tab changes the visible pane.
Three menus are available: Files, View and Colors. The files menu is useful for exiting Compus. The "view" menu is used to specify sorting orders as described in section "Sorting". The "Colors" menu is used to trigger the "optimize" color function as described in section "Controlling Color and Visibility of Elements".
The original pane displays one vertical colored bar per XML document. Each XML element is assigned a color and a starting and ending index, corresponding to the character offset where the element starts and ends. A document is visualized as an ordered collection of colored segments. Since XML elements are nested, inner elements overlap outer ones.
For example, the sample XML document in boldface:
0
1
2         3
       4

012345678901234567890123456789012345678901234567

<A>abcd<B>efgh</B><C>ijkl<D>mnop</D></C>qrst</A>
is first converted into the following list of intervals:
A=[0,48[, B=[7,18[, C=[18,40[, D=[25,36[
A color is then associated with each element name and the document is displayed. Each document is given the same amount of space, usually a thin vertical rectangle. The rectangle is considered as a long line that wraps. In this case, the line would have the following colors:
A: [0,7[, B: [7,18[, C: [18,25[, D: [25,36[, C: [36,40[, A: [40,48[
Wrapping the line every 5 pixels produces the following display:
|
Index |
Color |
||||
|
0 |
A |
A |
A |
A |
A |
|
5 |
A |
A |
B |
B |
B |
|
10 |
B |
B |
B |
B |
B |
|
15 |
B |
B |
B |
C |
C |
|
20 |
C |
C |
C |
C |
C |
|
25 |
D |
D |
D |
D |
D |
|
30 |
D |
D |
D |
D |
D |
|
35 |
D |
C |
C |
C |
C |
|
40 |
A |
A |
A |
A |
A |
|
45 |
A |
A |
A |
|
|
For displaying a corpus, each document is displayed in a given order (date in our corpus, corresponding to the order given on the command line) and is given the same rectangle. A scale factor is applied to the original indexes so that the longest document fits in the whole rectangle and all documents are comparable in length. Corpora displayable by Compus are limited by the screen size minus the width of the list box on the right, the scrollbar and a separator line, leaving room for about 500 documents on 1280x1024 screens. Our corpus contains 100 documents so each rectangle is 5 pixels wide, as shown in Figure 2.
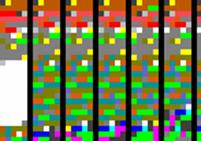
Figure 2: Close up view of the upper left part of the original pane
By applying this visualization to a corpus, users can at once compare document sizes and overall structure. As Figure 1 clearly shows, four parts are visible on our corpus, due to a change in texture. They correspond to the TEI header, the body of the text, a glossary and the description of the analytical categories. The 27th letter is much longer than the others and the first letter exhibits a gray zone at the end of the header or at the beginning of the body. The length of the 27th letter has even surprised the historian who encoded it. A judge has been found guilty of prevarication and asks for a special grace (something very specific to 1531). The particular gray zone is a revisionDesc element containing the description of changes made to the document. The first document has been subject to many more modifications than the others to fix rules we found suitable for the whole corpus. The mixed color of each part comes from the dominant encoding. The text part is full of abbreviations in maroon and dates in dark red. With just this first overview visualization, we can glean important clues about the contents of the corpus.
By positioning the pointer on a bar and keeping it idle for a second, a ToolTip pops up, showing the name of the document and the path of the indicated point in the document structure. In Figure 1, the ToolTip indicates "rB33-27-toulgret.xml null TEI.2 text body p lb", meaning the cursor is in the lb element, contained in a p element, text element and TEI.2 top-level element. The file is "rB33-27-toulgret.xml" is the file name. The null is intended to disappear eventually.
By clicking on a position, the XML document appears in the "Work" pane at the position of the click.
The right part of the pane contains a list of tag names and colors. Clicking on an item hides all the elements with that name in the visualization pane. Several items can be selected using the shift or control key. By maintaining the shift key; a range of items can be selected or deselected. By maintaining the control key, items are individually selected or deselected.
When visualizing a new corpus, users usually select all the items by clicking on one and typing Control-a which selects everything. Starting from the blank screen, users can select elements of interest.
For instance, control-clicking the item TEI.2 visualizes one large element for each document encoded in TEI (all the documents here). Control clicking on any additional item shows its distribution over the documents.
More interactions are described in section "Controlling Color and Visibility of Elements".
The work pane is visible when the user clicks on the tab or on a document bar. In the later case, the document is positioned at the location pointed by the user on the bar.
The text can be scrolled but not modified since Compus is not designed to edit XML documents. However, when an unexpected color is visualized or showed by a ToolTip, users may want to look at the XML text itself for explanation.
Interaction is very limited in that pane and users tend not to stay long in that pane, other tools being better suited for XML inspection.
The "Stylesheet" pane is designed to apply XSLT style sheets to the original documents as show in Figure 3. The pane has four parts: a local menu bar, a tool box, an interactive text editor to type or modify an XSLT program, and a "Combo Box", i.e. a text entry field that also behaves as a popup menu with the previous values entered in the field.
From this pane, users can load a file containing a valid XSLT program, type a new XSLT program, or modify an XSLT program.
Each XSLT program has a name. When loaded from a file, the name is the file names without suffix (the ".xsl' or ".xml" suffix is removed). When the user directly types a new style sheet, it is named "Stylesheet1" by default but can be renamed by typing a new name on the combo box.
Finally, clicking the "Apply" button applies the style sheet to the original documents and creates a new visualization pane on the tabbed pane with the style sheet name.
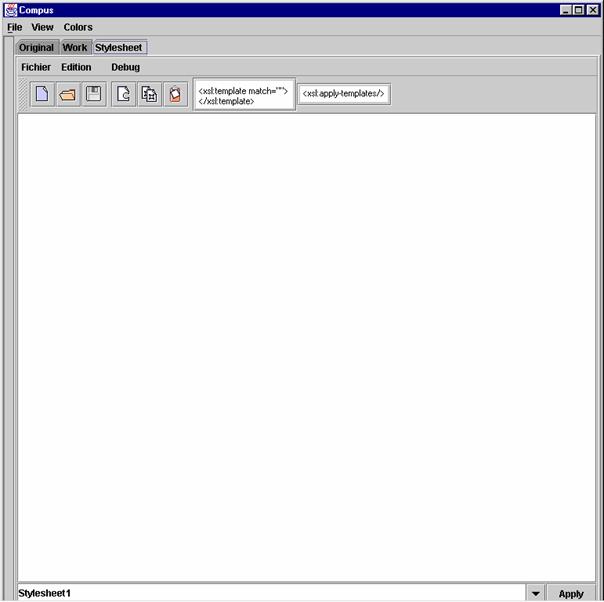
Figure3: The Stylesheet Pane
The expression of XSLT transformations is described in section "Revealing Encoded Phenomena Through Structural Transformation".
Interacting with Compus is mainly done in the original pane that may show the "Work" pane if you click. Finally, you will see the "Stylesheet" pane if you need to apply XSLT transforms to your corpus.
1. Each element type (i.e., tag name) is automatically assigned a color. Structured documents usually contain elements of various lengths, ranging from the full document to zero for empty elements. We compute the average size of each element and use three different color sets for large elements, middle sized elements and small elements. Large elements (over 100 characters long in average) use gray values, from black to white. Middle sized elements (from 10 to 100 characters) use the color scheme described by Healey and Linguistic Computing, 1994.
[Healey96]. Small elements use saturated red, green and blue colors.
With this allocation scheme, larger elements are less visible than middle sized elements and small elements are vivid and can be distinguished. When more colors are required, the automatic color allocation cycles through the color sets. Since our documents use many elements, interaction is required to reduce the set of displayed elements and reassign colors for effective search and discovery.
Healey has shown that 7 colors can be searched very quickly thanks to properties of our perceptual system. When starting to search for correlation with Compus, always try to limit the number of visible colors below 7. When a set of tag names is selected for visualization, users can tune the colors used either by asking Compus to optimize them or by doing the allocation by hand.
To let Compus optimize the color allocation, just trigger the "Optimize" item on the "Colors" menu. The element list will reflect the new allocation, as well as the visualization pane.
Colors can be allocated manually by right clicking on an element name in the list. Double-clicking also triggers the manual color allocation in case your mouse only has one button. Figure 4 shows the color chooser, standard in Java Swing.
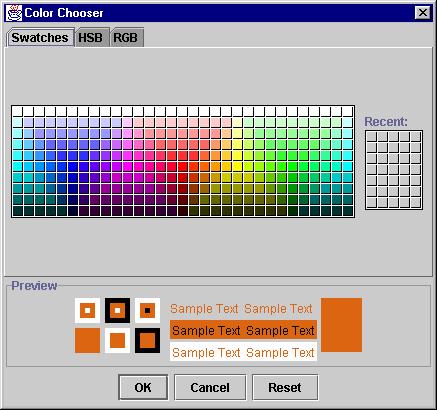
Figure 4: Color chooser for manually assigning a color to an element name
By default, Compus uses the visualization scheme described in section "The Original Pane" that displays the distribution of elements throughout the documents. Sometimes, you want to compare the relative importance of elements in the various documents. When selecting the "Sort Elements" item in the "View" menu, the document bars change as in Figure 5.
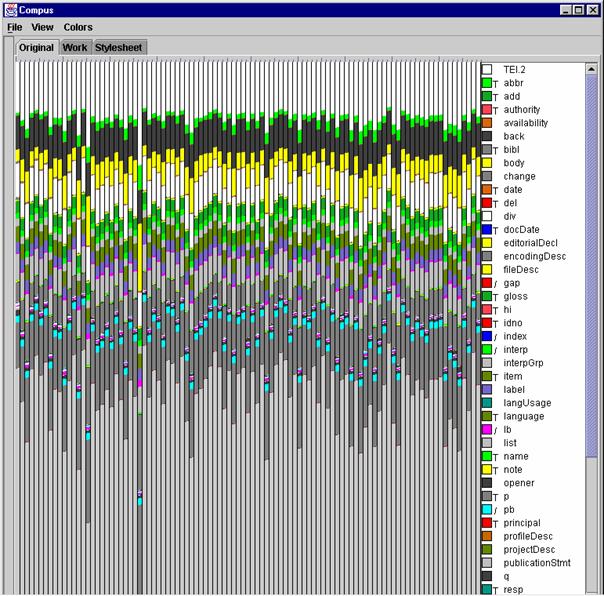
Figure 5: Aggregated visualization of
elements
Suppose you have a configuration like: <name><unclear>Mace</unclear></name>.
Two elements overlap and, according to our visualization method, one will hide the second (unclear will hide name.) In general, to avoid surprises like superposed elements, you should try to discover correlation from a minimal set of displayed elements. In this case; if you are interested in looking at names inside your documents, hide everything first and select the name tag name in the color selection list. By selecting tags of interest in an incremental order, you will certainly notice the disappearing of a colored region thanks to the sensitivity of your visual system.
You may wonder "which document contains more names". Compus can sort documents according to various orders: increasing/decreasing number of visible elements, increasing/decreasing surface of visible elements or revert to the original order.
All these options are available through the "View" menu. Note that the sorting order affects all the visualization panes. If you have applied one style sheet that only displays a filtered version of the documents and sort it according to any order, the original pane displays the documents in the same order. This is useful if you want to correlate events that use different encoding mechanisms.
Compus can apply XSLT [XSLT] programs. XSLT has originally been designed for expressing Style sheets to format an XML document for printing or online display. XSLT applies rules to a source XML document to transform it into another XML document. We have integrated an XSLT processor into Compus to filter and refine the visualization of corpora.
XSLT rules have two parts: a match part and an action part. Conceptually, the XSLT processor does a traversal of the source document, searches for the most specific match at each node and applies the related action. This action returns a new structure or nothing. It may continue the traversal on sub elements of the source to build its new structure.
For example, only to process the body of a TEI document, the XSLT rule would be:
<xsl:template rule="/">

 <xsl:apply-templates select="//body"/>

</xsl:template>
This simple transformation extracts only the sub-tree starting at the body element of the document.
XSLT has two implicit rules saying that when no specific rule is defined, the text is copied and elements are ignored.
To copy each element, wildcard rules can be used like:
<xsl:template rule="*">

 <xsl:copy>

  <xsl:apply-templates/>

 </xsl:copy>

</xsl:template>
By using XSLT, the document structure can be changed: some elements can be discarded, new elements can be added and the contents of element can be filtered.
Instead of describing the XSLT language in length, we provide some example rules we used for our corpus.
To be documented
Working on the WWW
Scrolling and splitting the screen vertically to see more documents
Visualizing word occurrences or structured search à la SGREP
2. [SX] Converter of SGML to XML
3. [TEI] C. M. Sperberg-McQueen and Lou Burnard (eds.) Guidelines for Electronic Text Encoding and Interchange (TEI P3), Volumes 1 and 2, The Association for Computers and the Humanities, the Association for Computational Linguistics, and the Association for Literary and Linguistic Computing, 1994.
4. [Healey96] Christopher G. Healey Choosing Effective Colours for Data Visualization Proceedings of the Conference on Visualization, pp. 263-270, IEEE, October 27- Nov 1 1996.
5. [XSLT] Clark, J. XSL Transformations (XSLT) Version 1.0 W3C Working Draft. Available at http://www.w3.org/TR/WD-xslt