Time-cutting :

1

Are there networks in maps? An experimental visualization of personal movement data

Heike Otten, Lennart Hildebrandt, Till Nagel, Marian Dörk, Boris Muller (2015)

2

Small MultiPiles: Piling Time to Explore Temporal Patterns in Dynamic Networks

Bach, Henry Riche, Dwyer, Madhyastha, Fekete, Grabowski (2015)

3

Visualizing Dynamic Networks with Matrix Cubes

Bach, Pietriga, Fekete (2014)

4

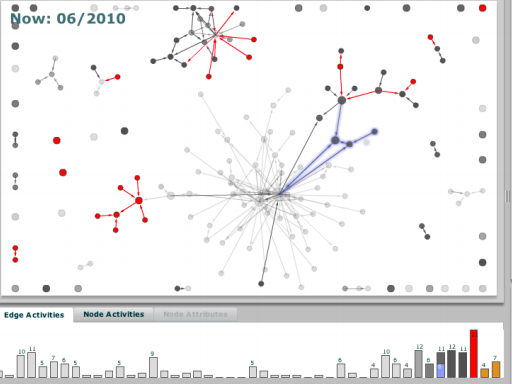
GraphDiaries: Animated Transitions and Temporal Navigation for Dynamic Networks

Bach, Pietriga, Fekete (2014)

5

Space-Time Visual Analytics of Eye-Tracking Data for Dynamic Stimuli

Kurzhals, Weisskopf (2013)

6

Bundled Visualization of Dynamic Graph and Trail Data.

Hurter, Ersoy, Fabrikant, Klein, Telea (2013)

7

DiffAni: Visualizing Dynamic Graphs with a Hybrid of Difference Maps and Animation

Rufiange, McGuffin (2013)

8

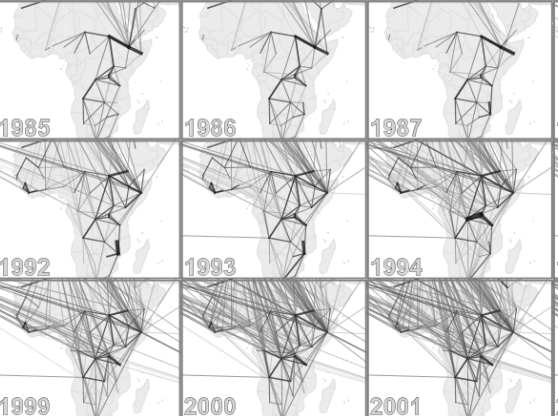
A Qualitative Study on the Exploration of Temporal Changes in Flow Maps with Animation and Small-Multiples

Boyandin, Bertini, Lalanne (2012)

9

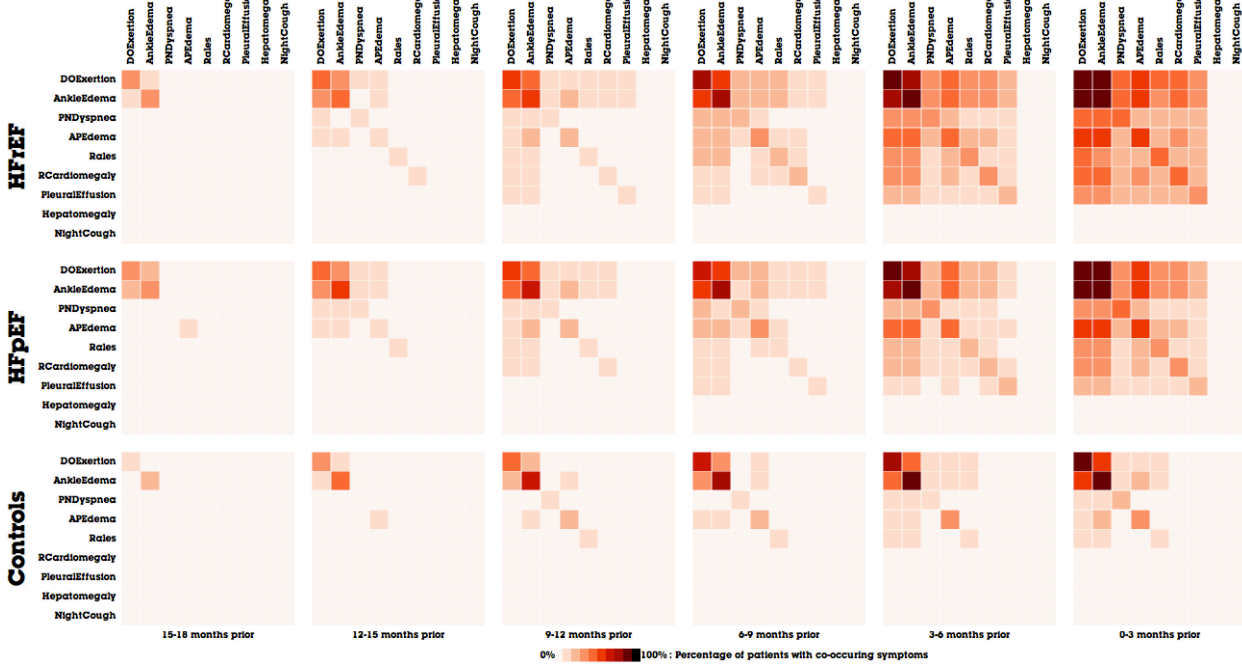
MatrixFlow: temporal network visual analytics to track symptom evolution during disease progression

Perer (2012)

10

Clustering, Visualizing, and Navigating for Large Dynamic Graphs

Sallaberry, Muelder, Ma (2012)

11

Stacking-Based Visualization of Trajectory Attribute Data

Tominski, Schumann, Andrienko, Andrienko (2012)

12

Network-based Visual Analysis of Tabular Data

Liu, Stasko (2011)

13

Temporal Visualization of Social Network Dynamics: Prototypes for Nation of Neighbors

Ahn, Taieb-Maimon, Sopan, Plaisant, Shneiderman (2011)

14

NetVisia: Heat Map & Matrix Visualization of Dynamic Social Network Statistics & Content

Gove, Gramsky, Kirby, Sefer, Sopan, Dunne, Shneiderman, Taieb-Maimon (2011)

15

A Visual Analytics Approach to Dynamic Social Networks

Federico, Aigner, Miksch, Windhager, Zenk (2011)

16

Wakame: sense making of multi-dimensional spatial-temporal data

Clifton Forlines, Kent Wittenburg (2010)

17

Effectiveness of Animation in Trend Visualization

Robertson, Fernandez, Fisher, Lee, Stasko (2010)

18

Honeycomb: Visual Analysis of Large Scale Social Networks

Ham, Schulz, Dimicco (2009)

19

2D and 3D representations for feature recognition in time geographical diary data

Vrotsou, Forsell, Cooper (2009)

20

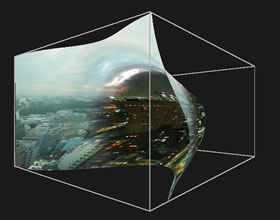
Khronos Projector

Cassinelli (2005)

21

Visual Understanding of Metabolic Pathways Across Organisms Using Layout in Two and a Half Dimensions

Brandes, Dwyer, Schreiber (2004)

22

GraphAEL: Graph Animations with Evolving Layouts

Erten, Harding, Kobourov, Wampler, Yee (2004)

23

Interactive Visual Tools to Explore Spatio-Temporal Variation

Andrienko, Andrienko (2004)

24

Analysis and Visualization of Social Networks

Brandes (2003)

25

A System for Graph-Based Visualization of the Evolution of Software

Collberg, Kobourov, Nagra, Pitts, Wampler (2003)

26

Video Visualization

Daniel, Chen (2003)

27

Graph Drawing in Motion

Friedrich, Eades (2002)
28

Preserving the Mental Map using Foresighted Layout

Diehl, Görg, Kerren (2001)

29

The Marey Graph Animation Tool Demo

Friedrich, Eades (2001)

30

The Tardis: A Visual Exploration Environment for Landscape Dynamics

Carpendale, Cowperthwaite, Tigges, Fall, Fracchia (1999)

31

DIVA: Exploratory Data Analysis with Multimedia Streams

Mackay, Beaudouin-Lafon (1998)

32

Nude Descending a Staircase, No. 2

Duchamp (1912)

33

Chronophotography

Marey (1880)

Filter:

Show all (89)