A Review of Temporal Visualizations
based on
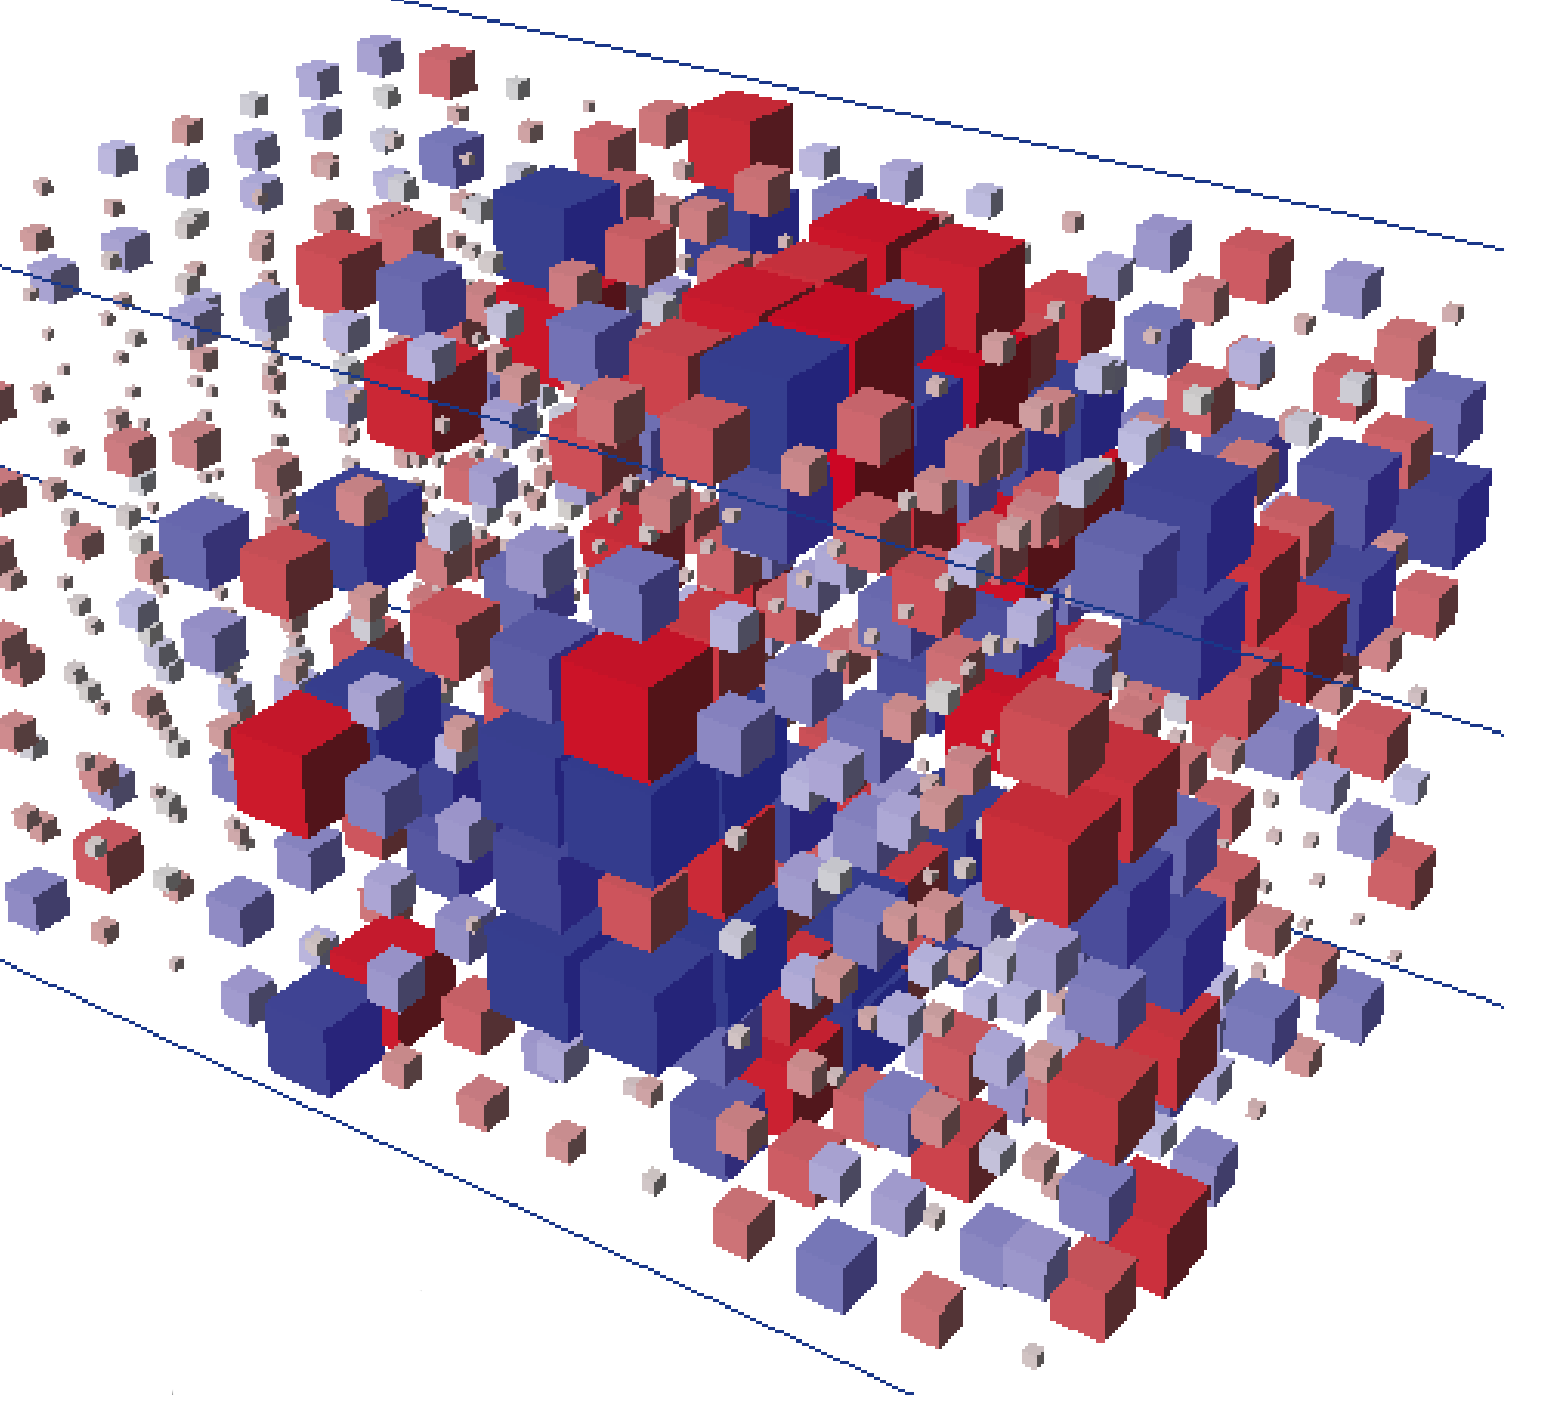
Generalized Space-Time Cube Operations
Ceci n'est pas de la 3D


Shading:
| Filter:Show all (89)
Further Visualization Surveys:dynamicgraphs.fbeck.com timeviz.net treevis.net setviz.net aviz.fr/physvis financevis.net textvis.lnu.se multivis.net paperviz.org |


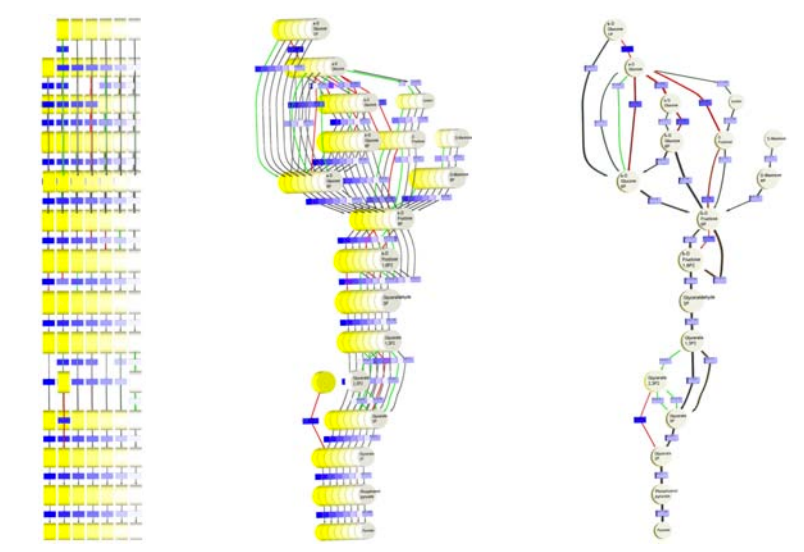


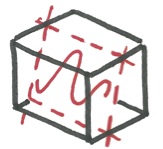
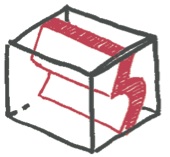
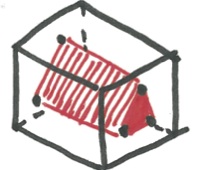
 Oblique-drilling (1)
 Planar-curvilinear-drilling (0)
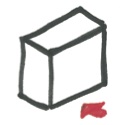
 Oblique-cutting (0)
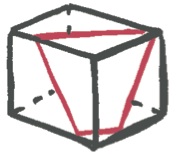
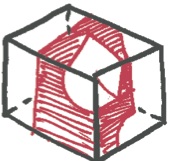
 Non-planar-cutting (1)
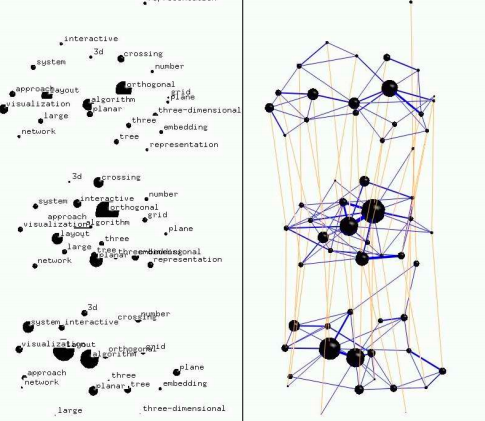
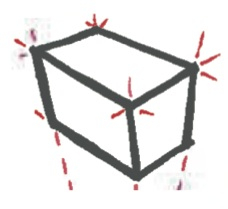
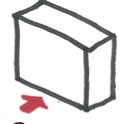
 Oblique-chopping (3)
 Curvilinear-space-chopping (0)
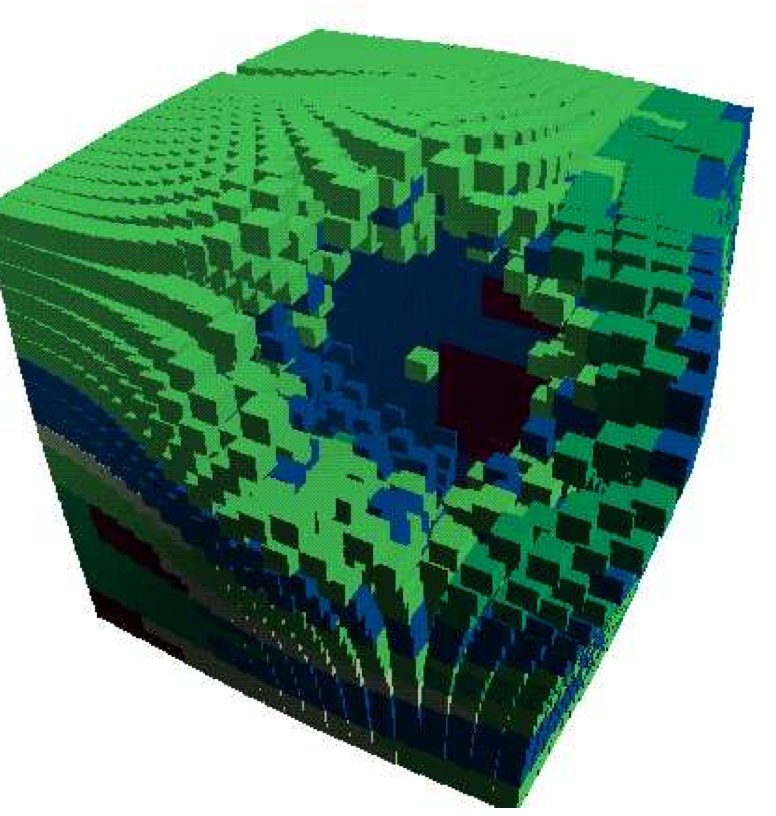
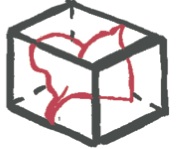
 Non-planar-chopping (2)
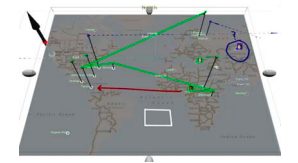
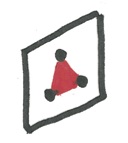
 Non-planar-flattening (0)
 Space-interpolation (0)
 Volume-interpolation (0)
 Time-scaling (2)
 Space-scaling (1)
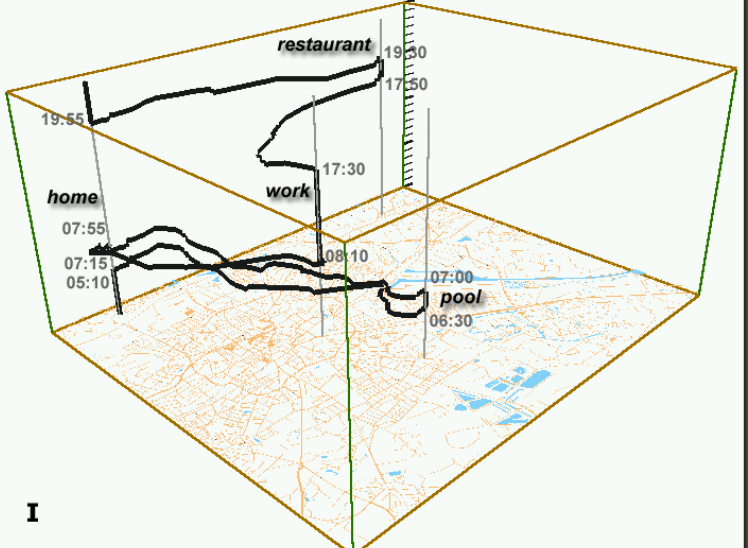
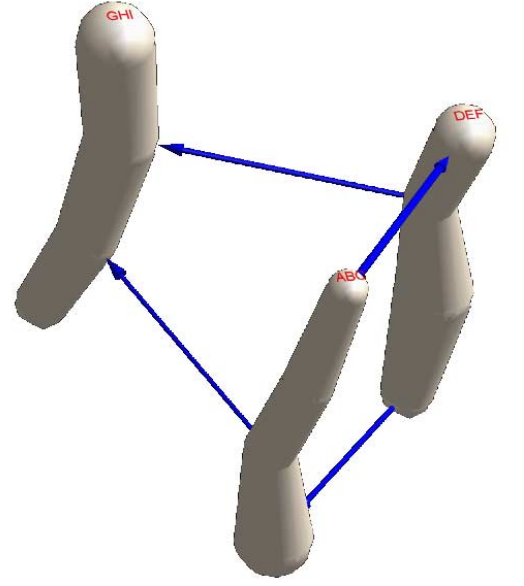
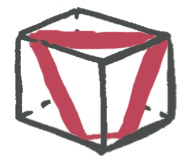
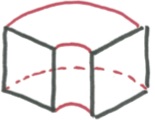 Bending (3)
 Time-labeling (0)
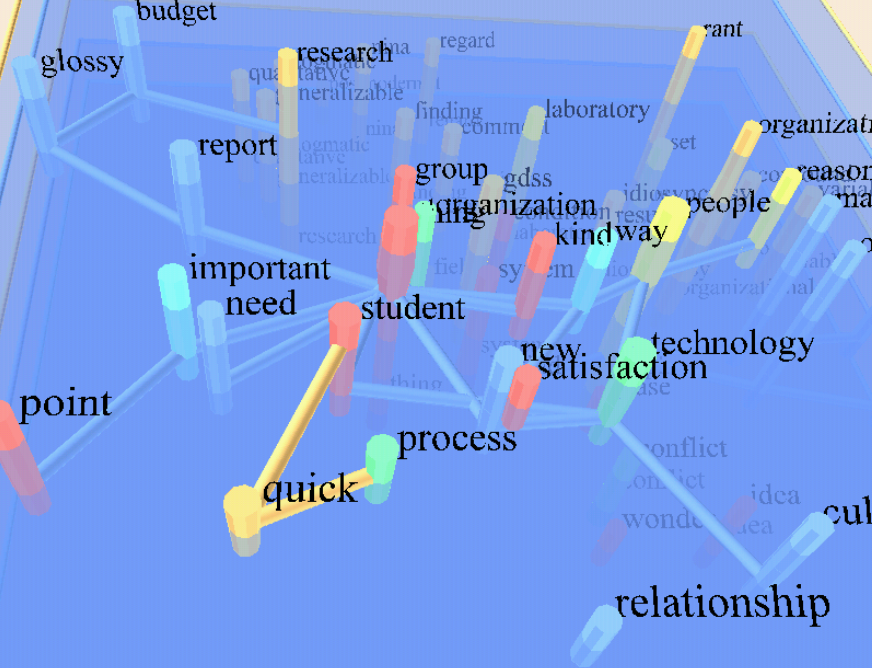
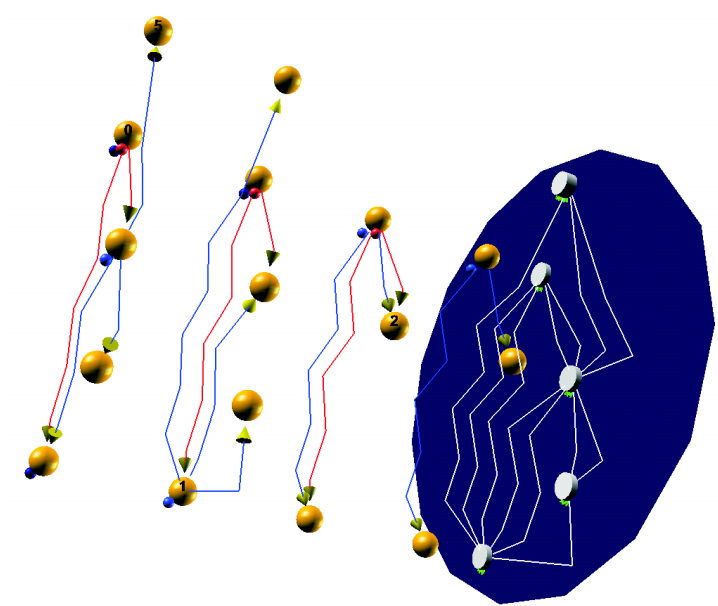
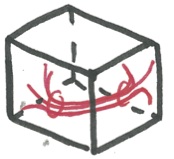 Bundeling (2)