Results:|
|
|
|
|
|
|
|
|
|
|
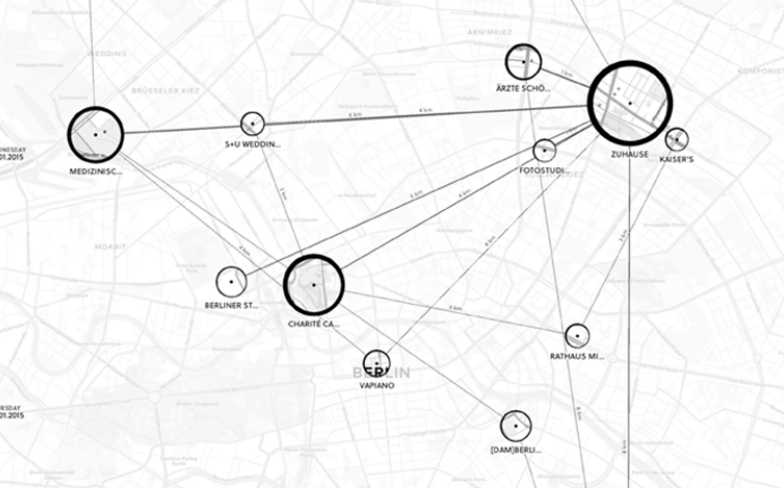
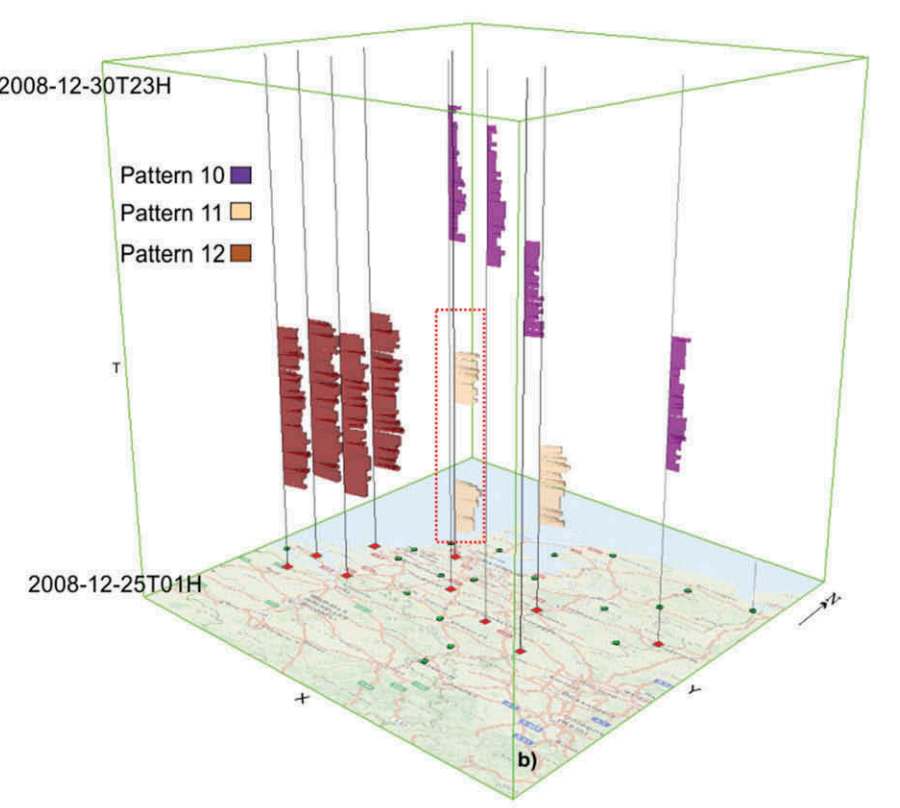
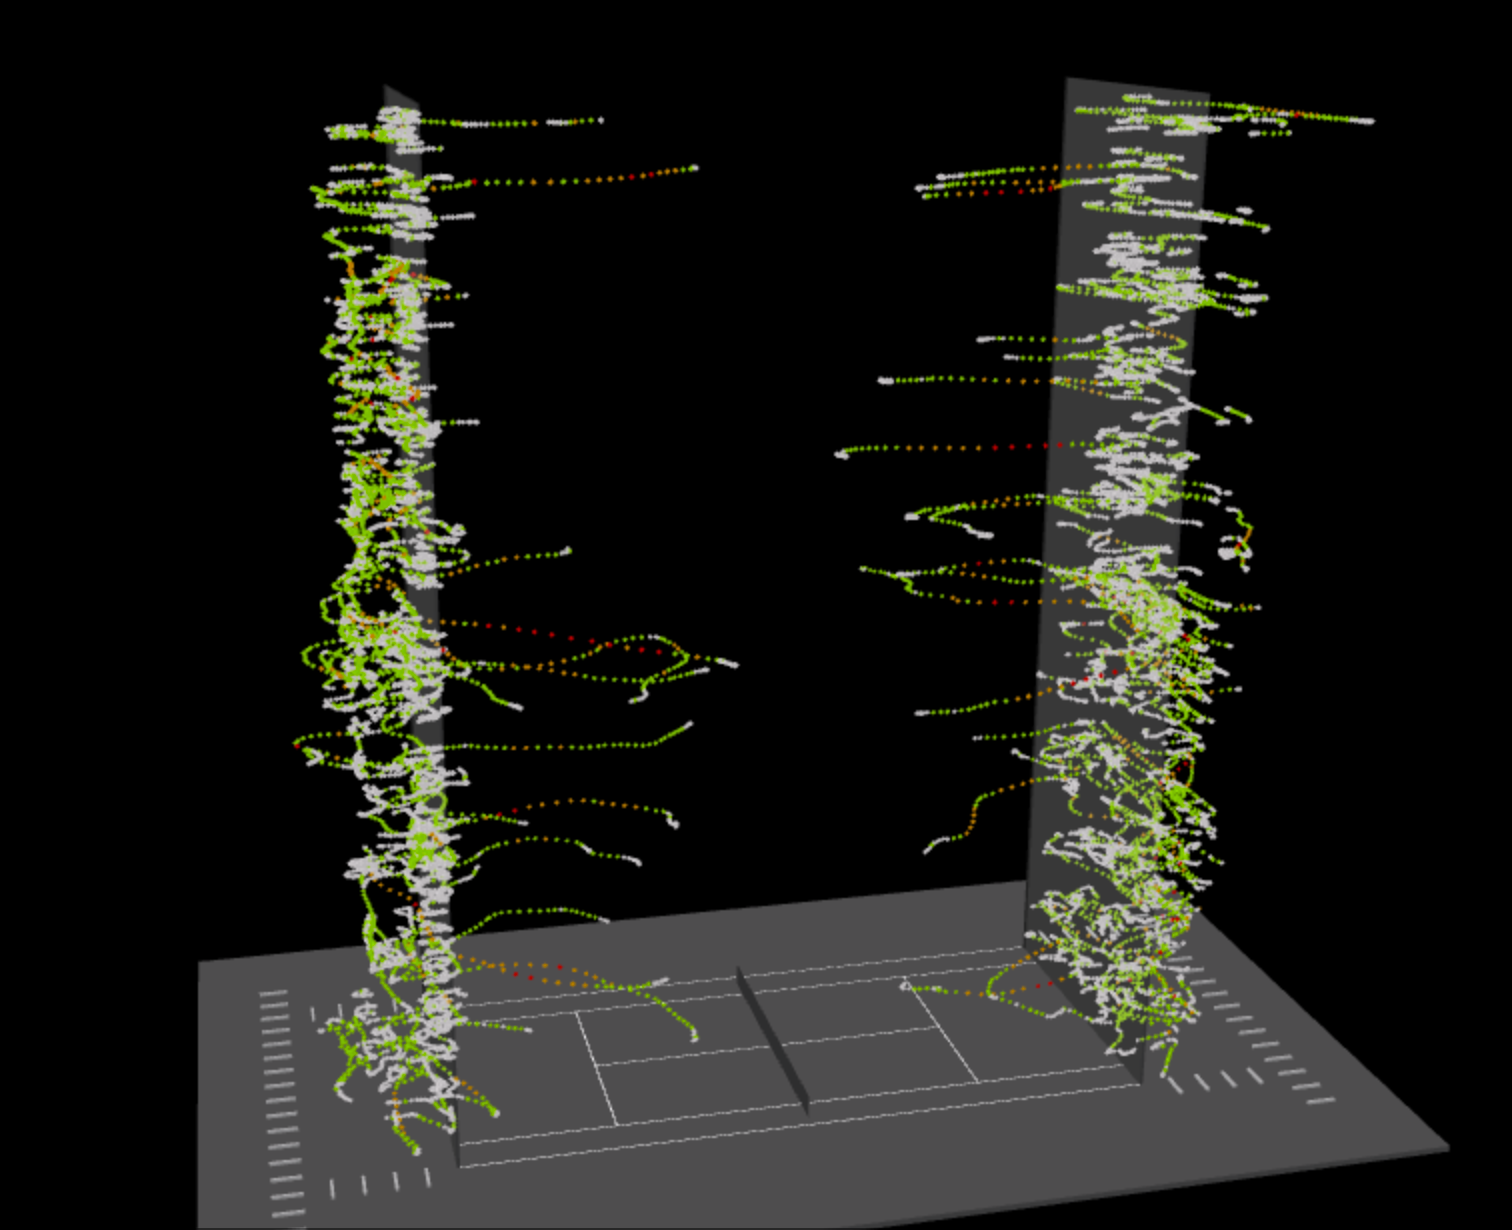
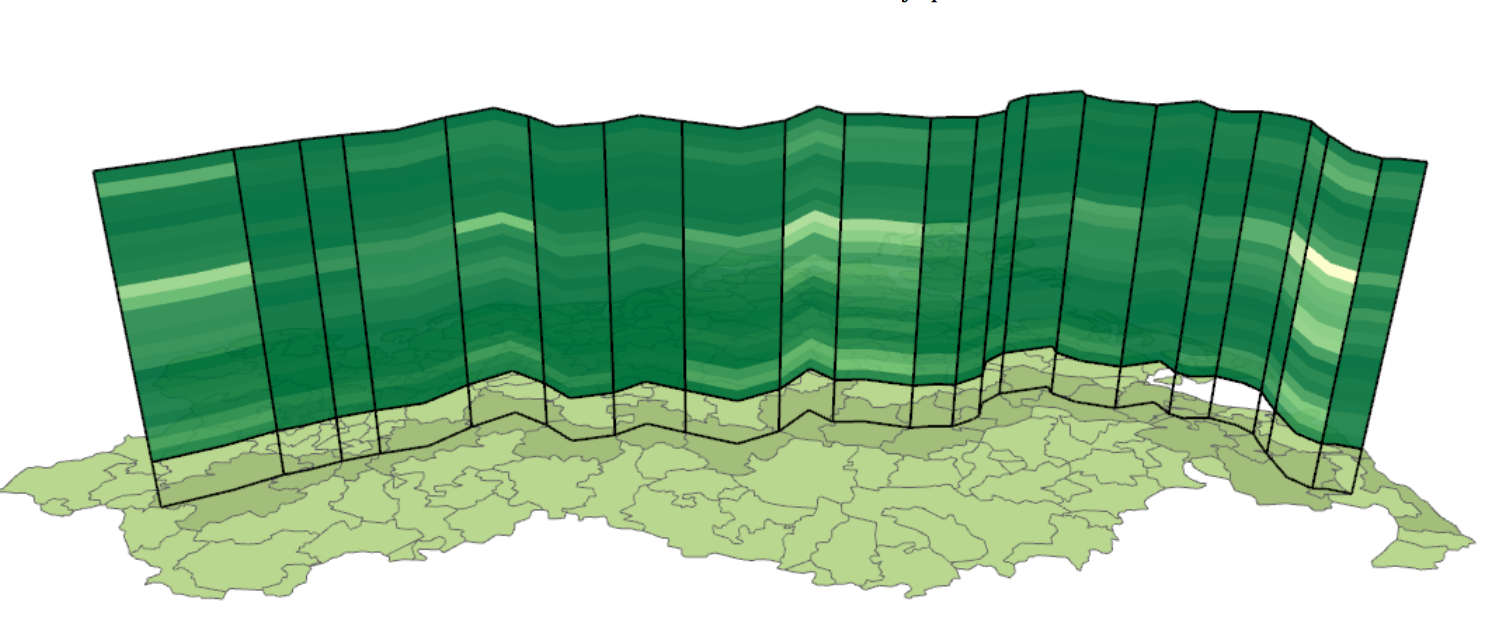
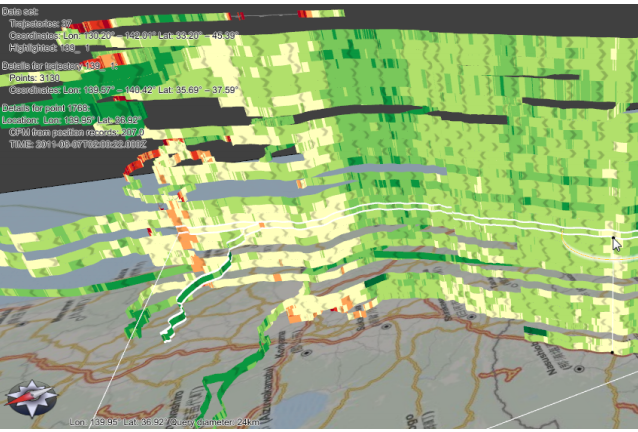
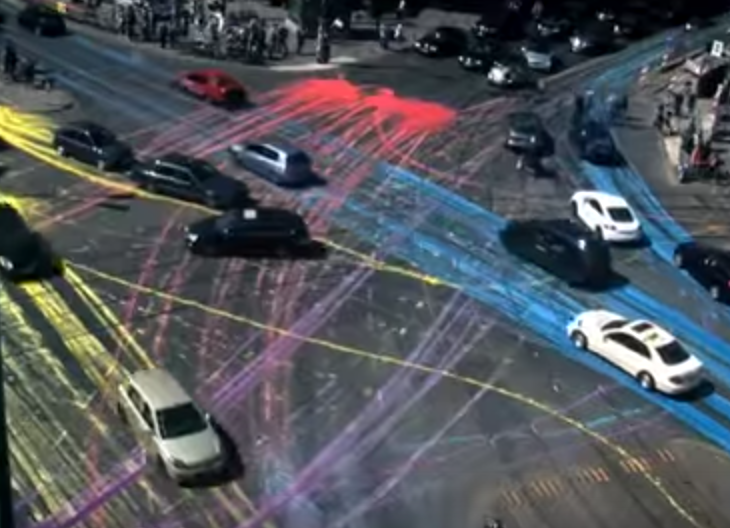
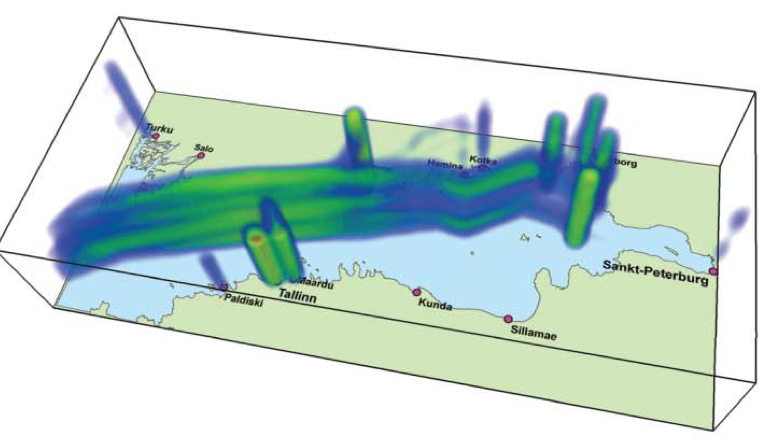
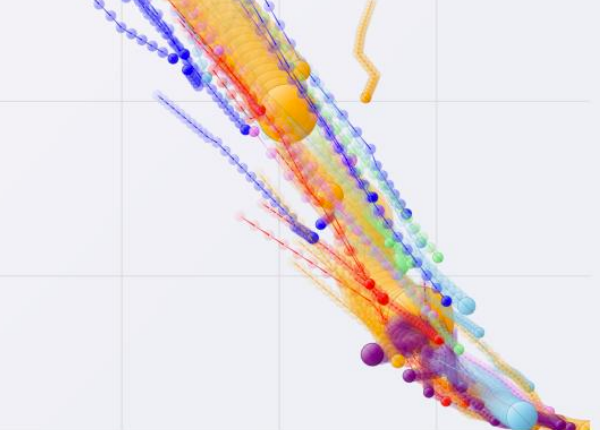
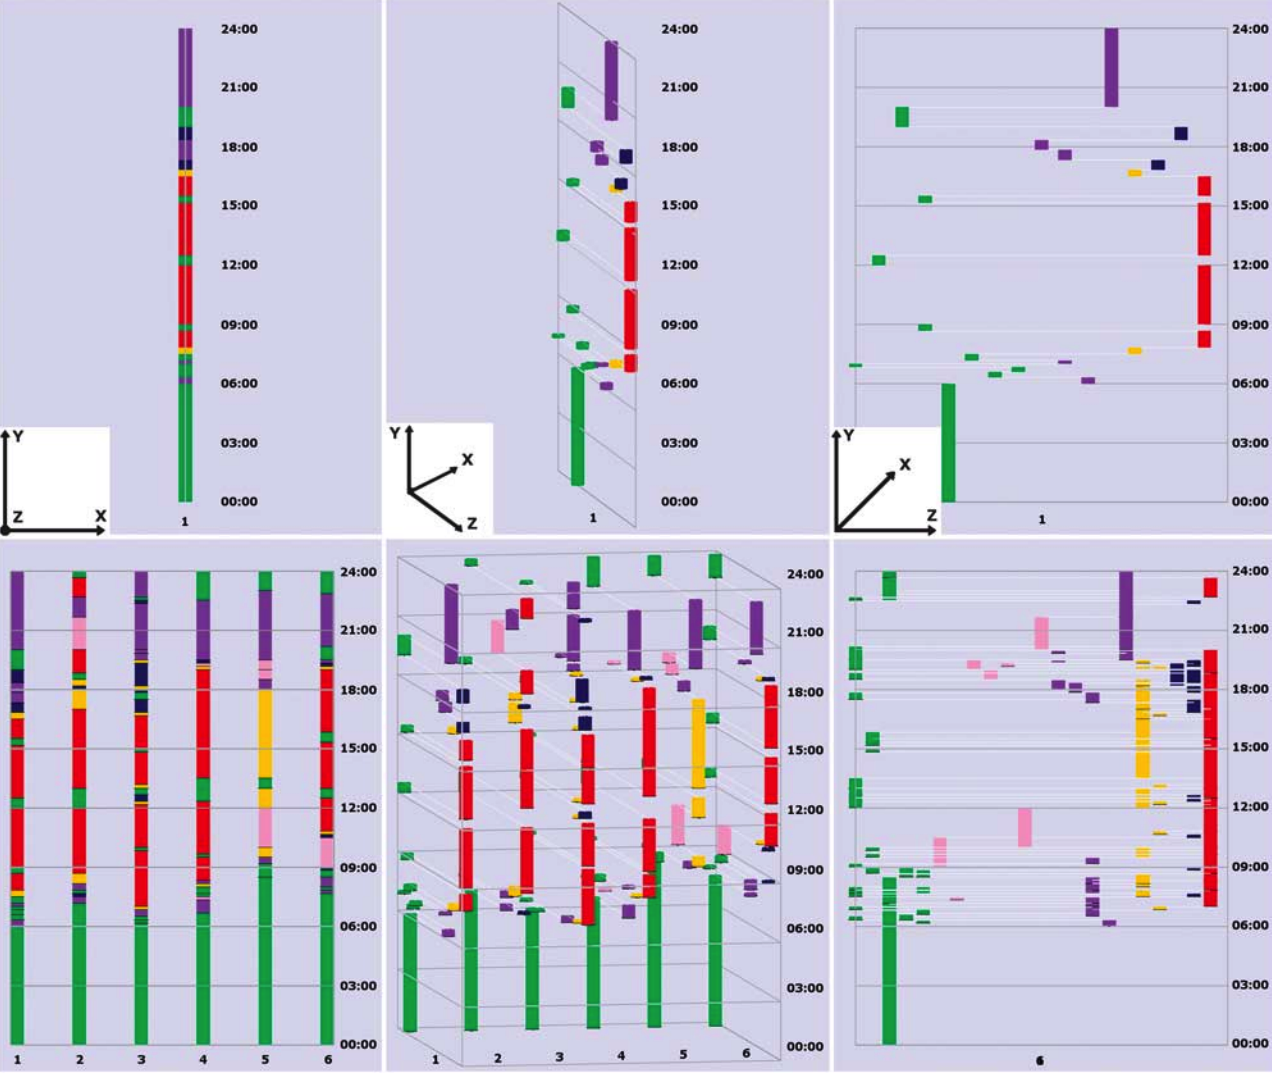
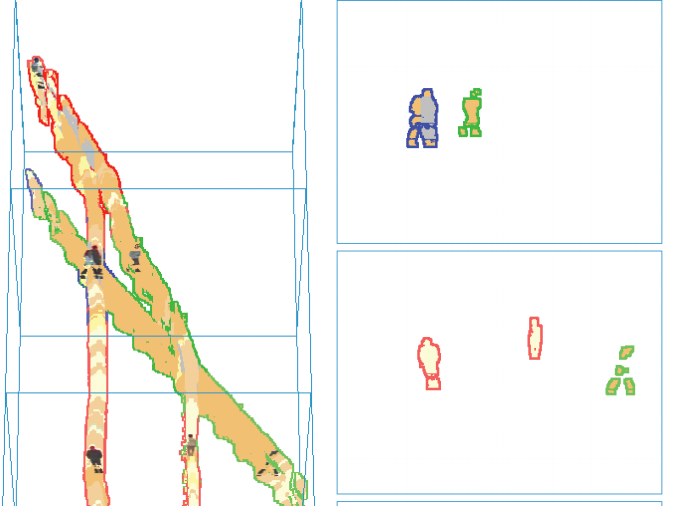
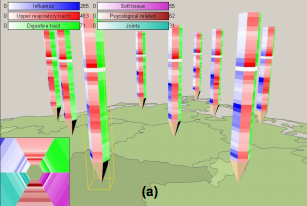
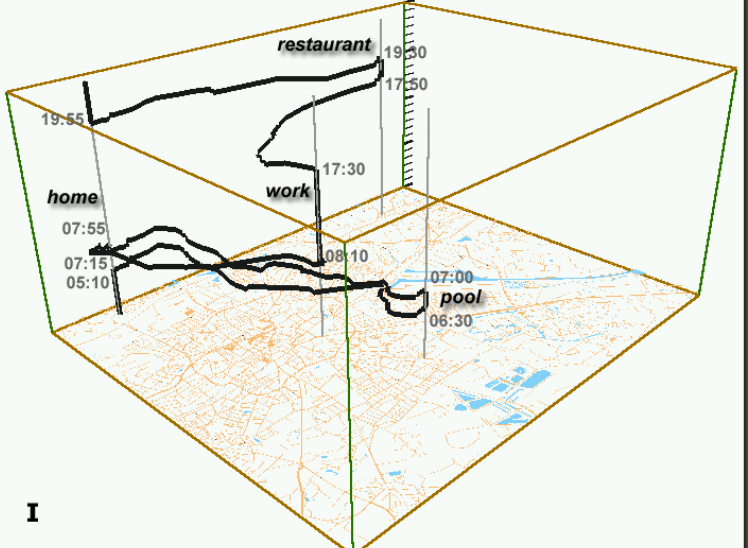
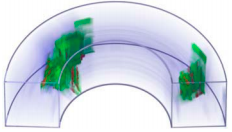
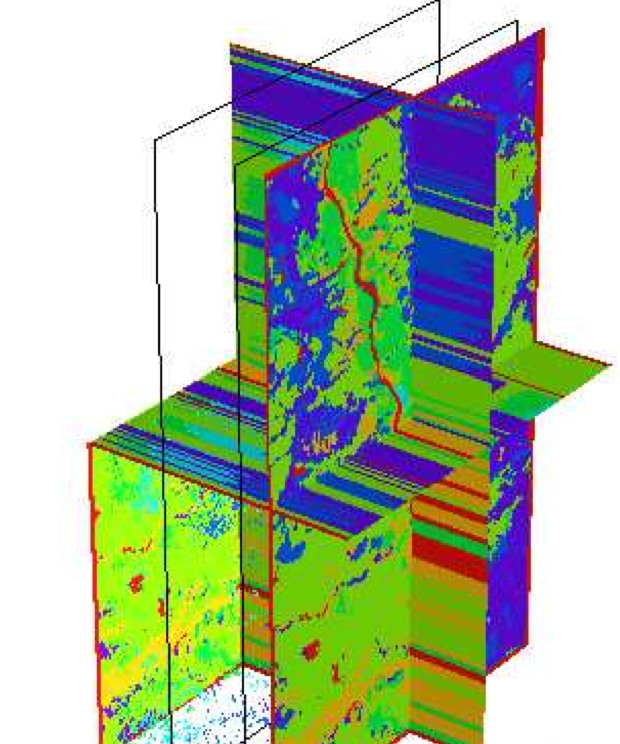
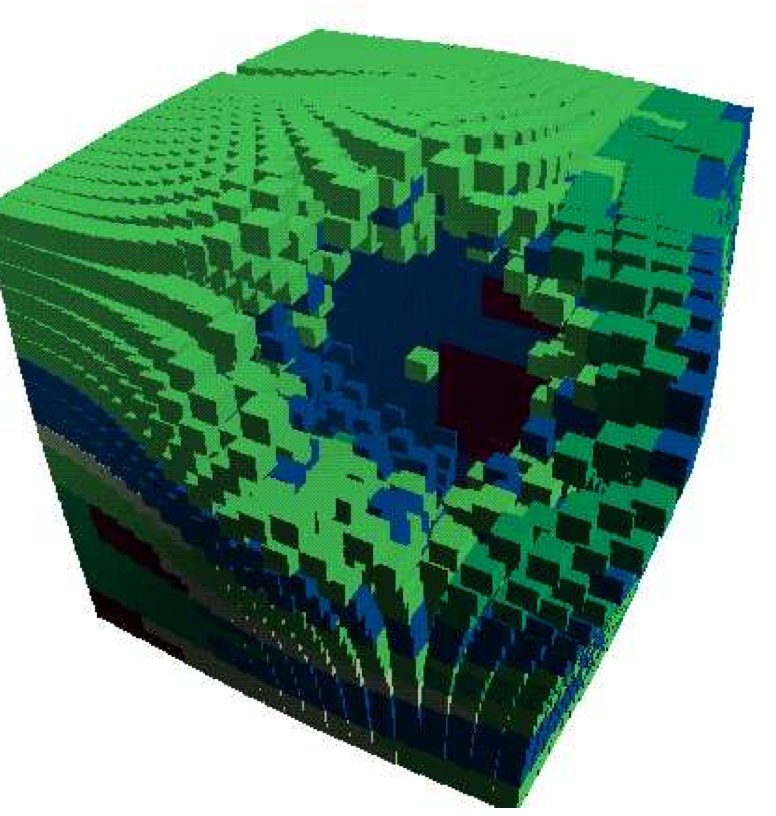
| 12 | 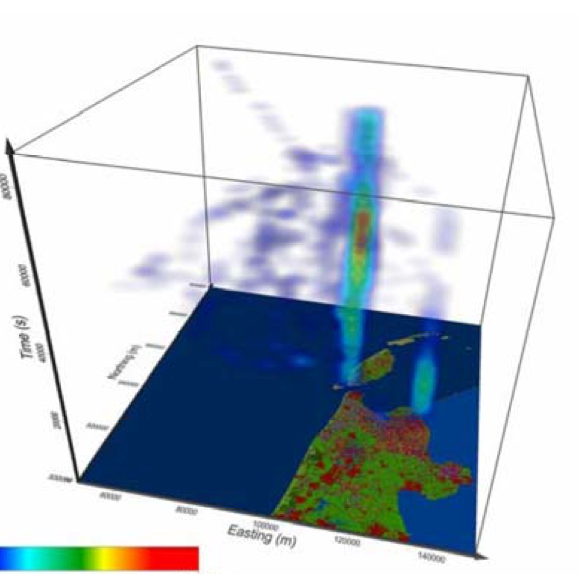 | Stacked space-time densities: a geovisualisation approach to explore dynamics of space use over time Demsar, Buchin, van Loon, Shamoun-Baranes (2014)  | |
|
|
|
|
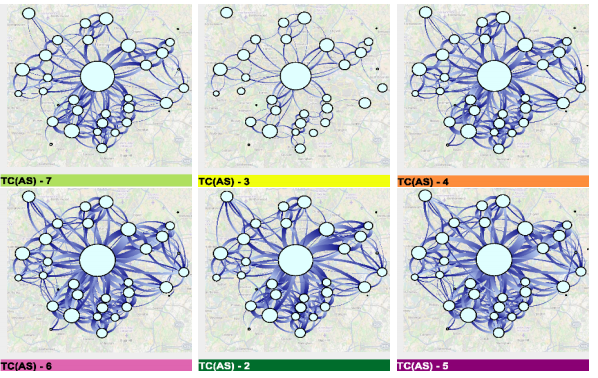
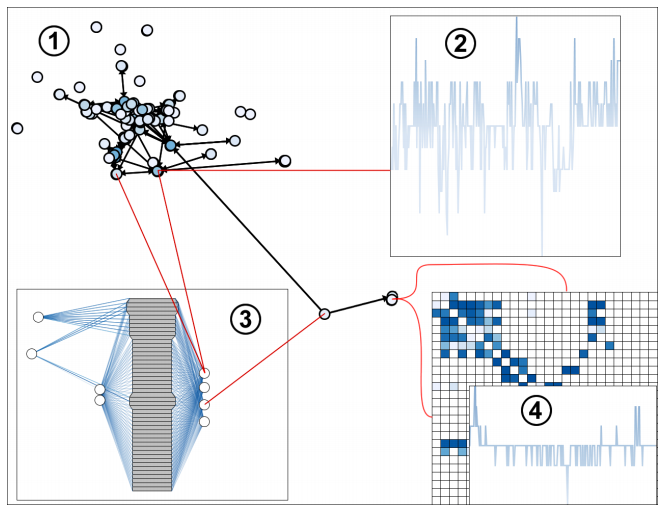
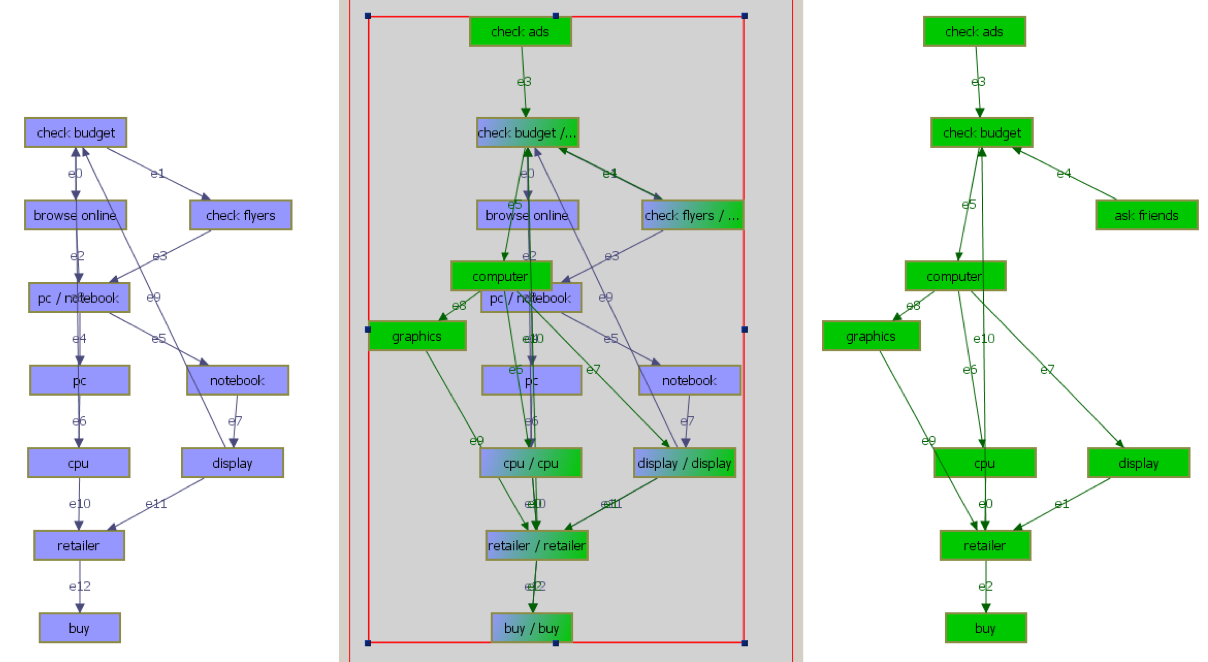
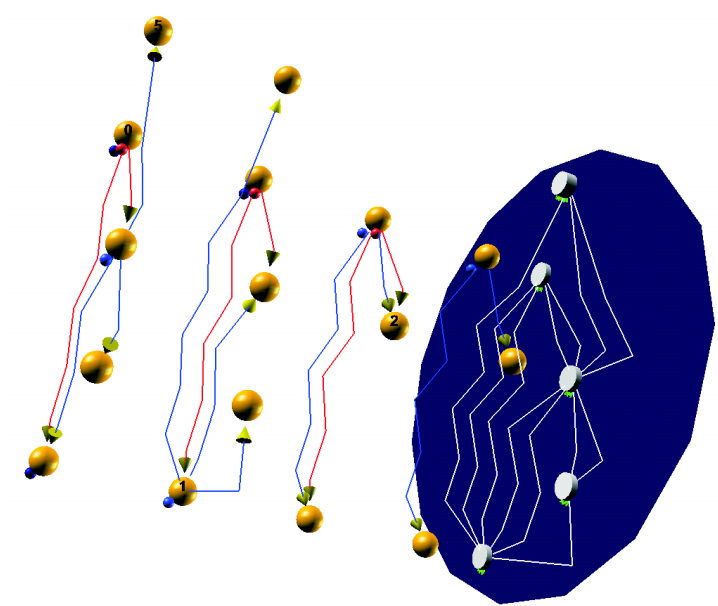
| 18 | 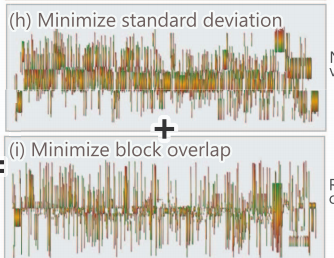 | Dynamic Network Visualization with Extended Massive Sequence Views Elzen, Holten, Blaas, van Wijk (2013)   | | 19 | 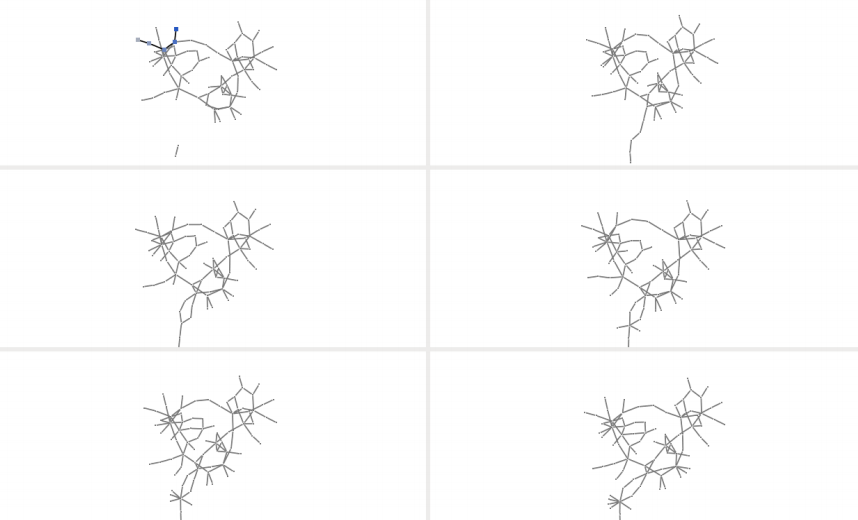 | Mental Map Preservation Helps User Orientation in Dynamic Graphs Archambault, Purchase (2013) | | 20 | 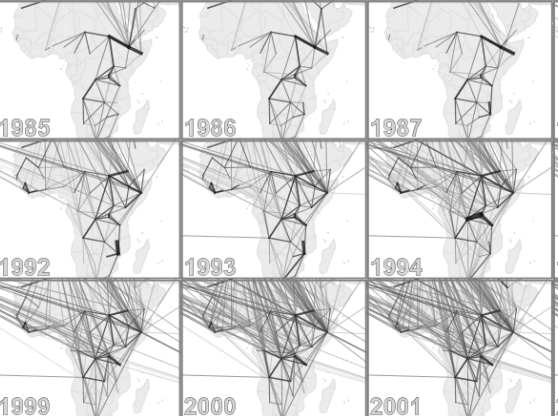 | A Qualitative Study on the Exploration of Temporal Changes in Flow Maps with Animation and Small-Multiples Boyandin, Bertini, Lalanne (2012)   | |
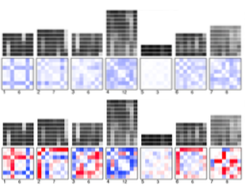
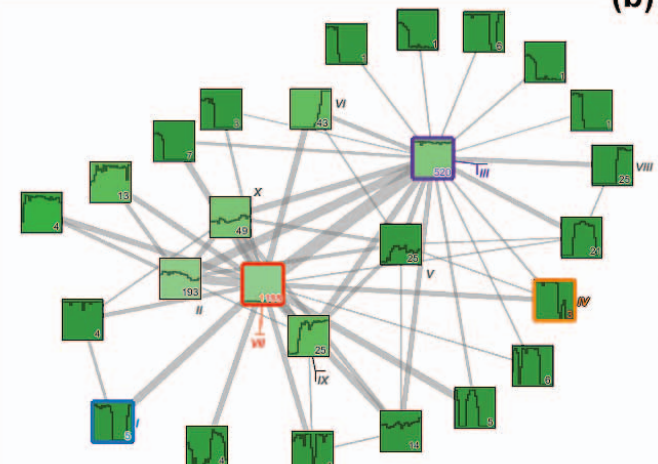
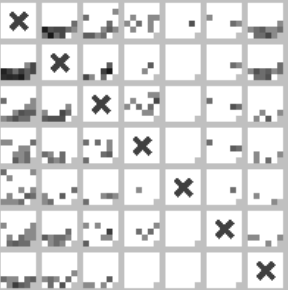
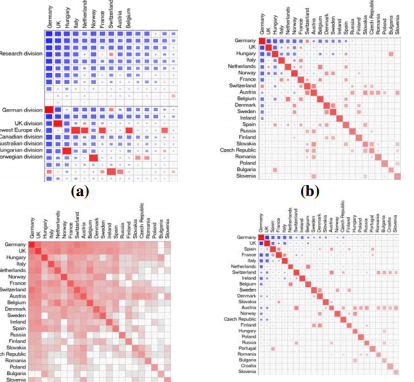
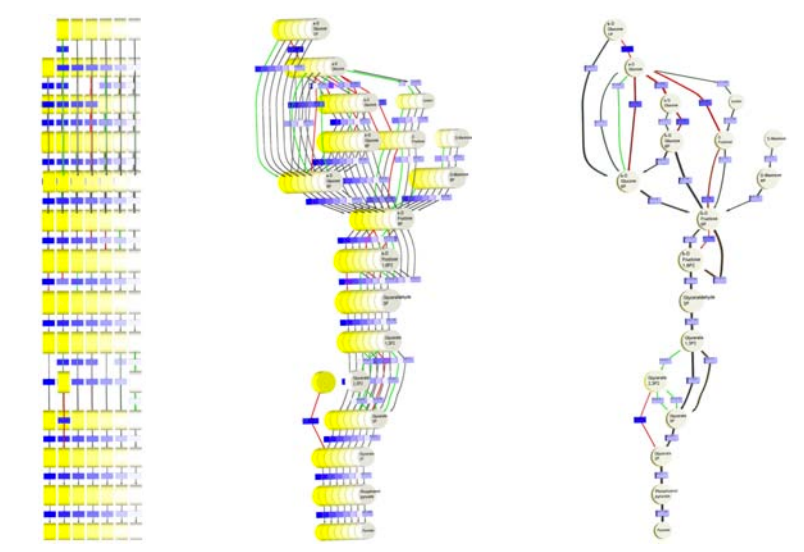
| 22 | 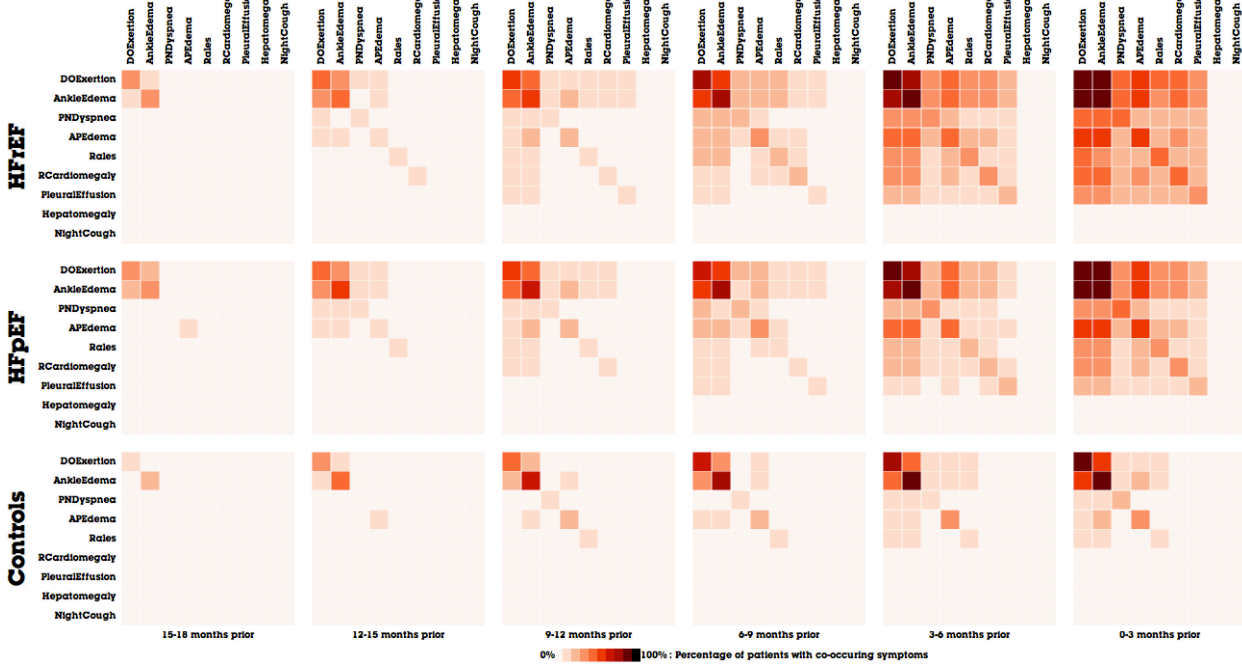 | MatrixFlow: temporal network visual analytics to track symptom evolution during disease progression Perer (2012)  | |
|
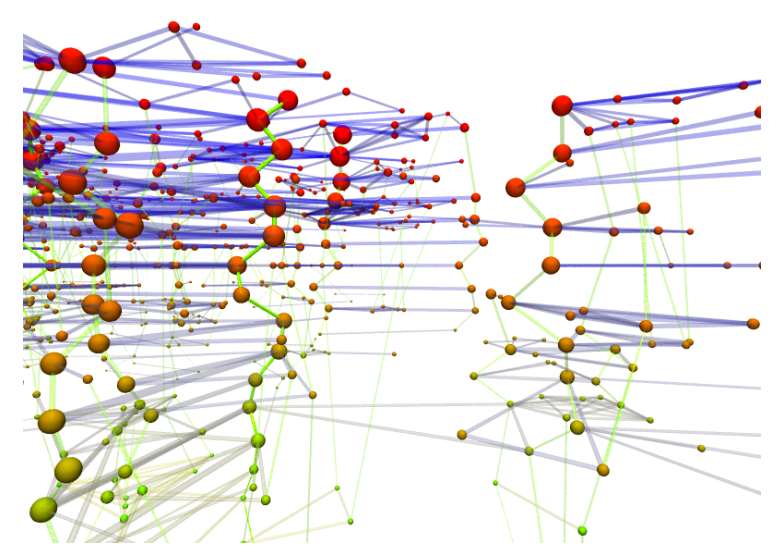
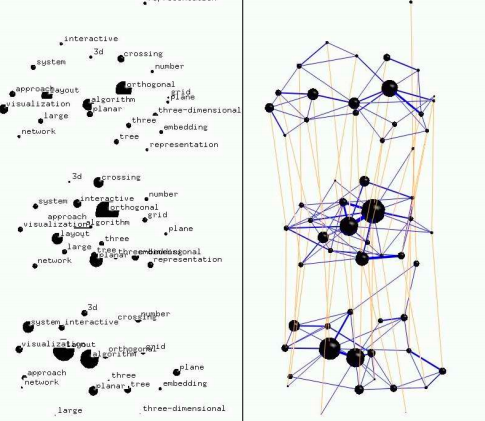
| 25 | 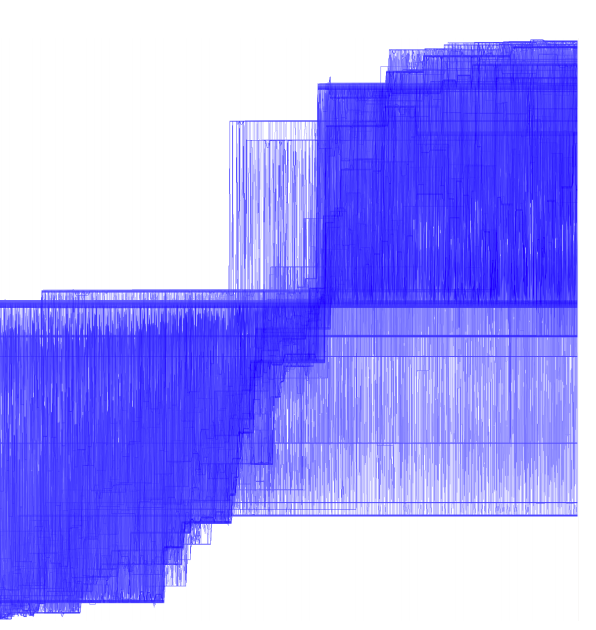 | Clustering, Visualizing, and Navigating for Large Dynamic Graphs Sallaberry, Muelder, Ma (2012) | |
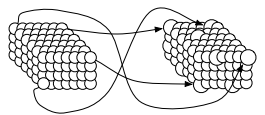
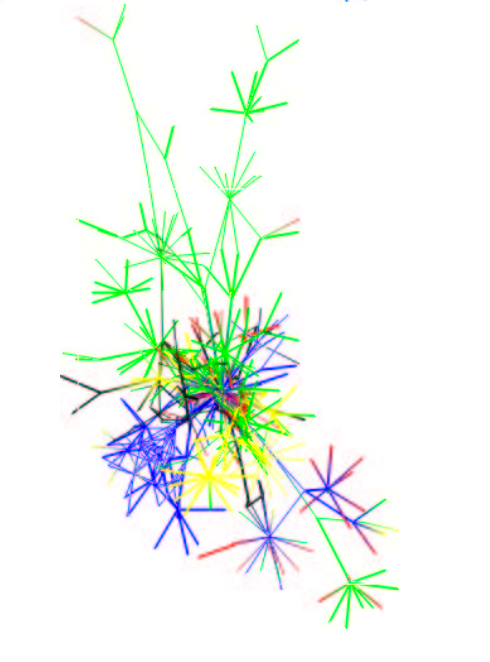
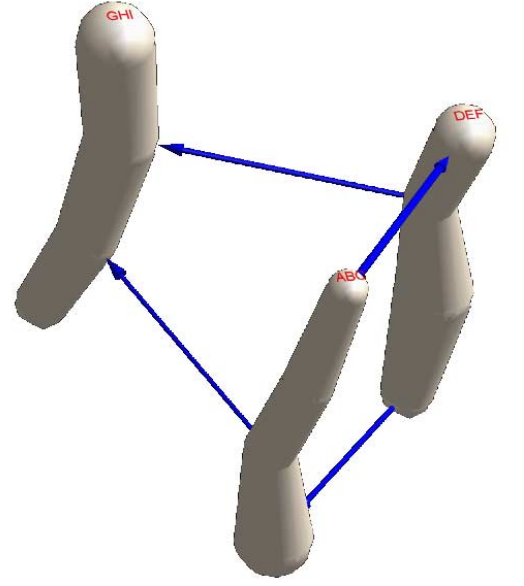
| 27 | 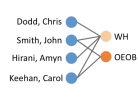 | Network-based Visual Analysis of Tabular Data Liu, Stasko (2011) | | 28 | 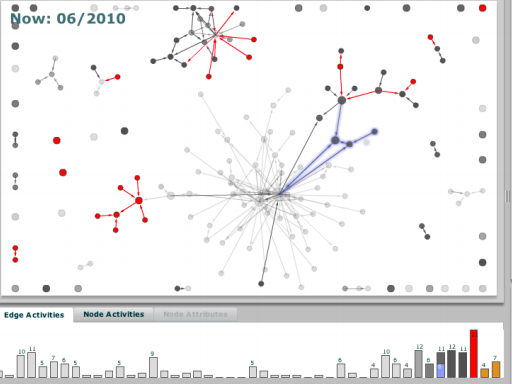 | Temporal Visualization of Social Network Dynamics: Prototypes for Nation of Neighbors Ahn, Taieb-Maimon, Sopan, Plaisant, Shneiderman (2011) | | 29 | 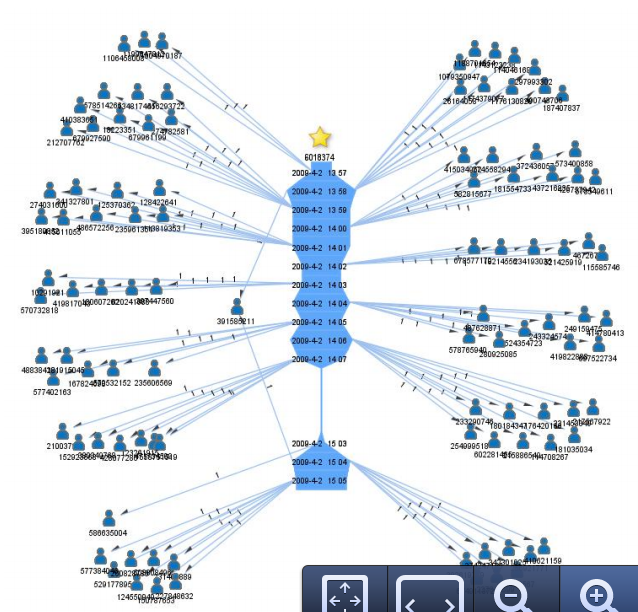 | Dynamic Network Visualization in 1.5D Shi, Wang, Wen (2011)   | |
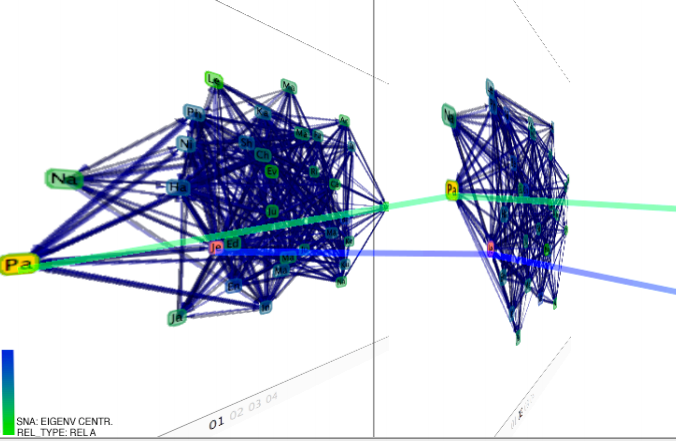
| 31 | 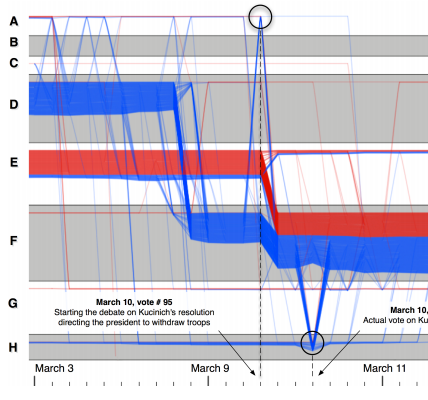 | Visualizing the evolution of community structures in dynamic social networks Reda, Tantipathananandh, Johnson, Leigh, Berger-Wolf (2011) | | 32 |  | Asymmetric Relations in Longitudinal Social Networks Brandes, Nick (2011)  | |
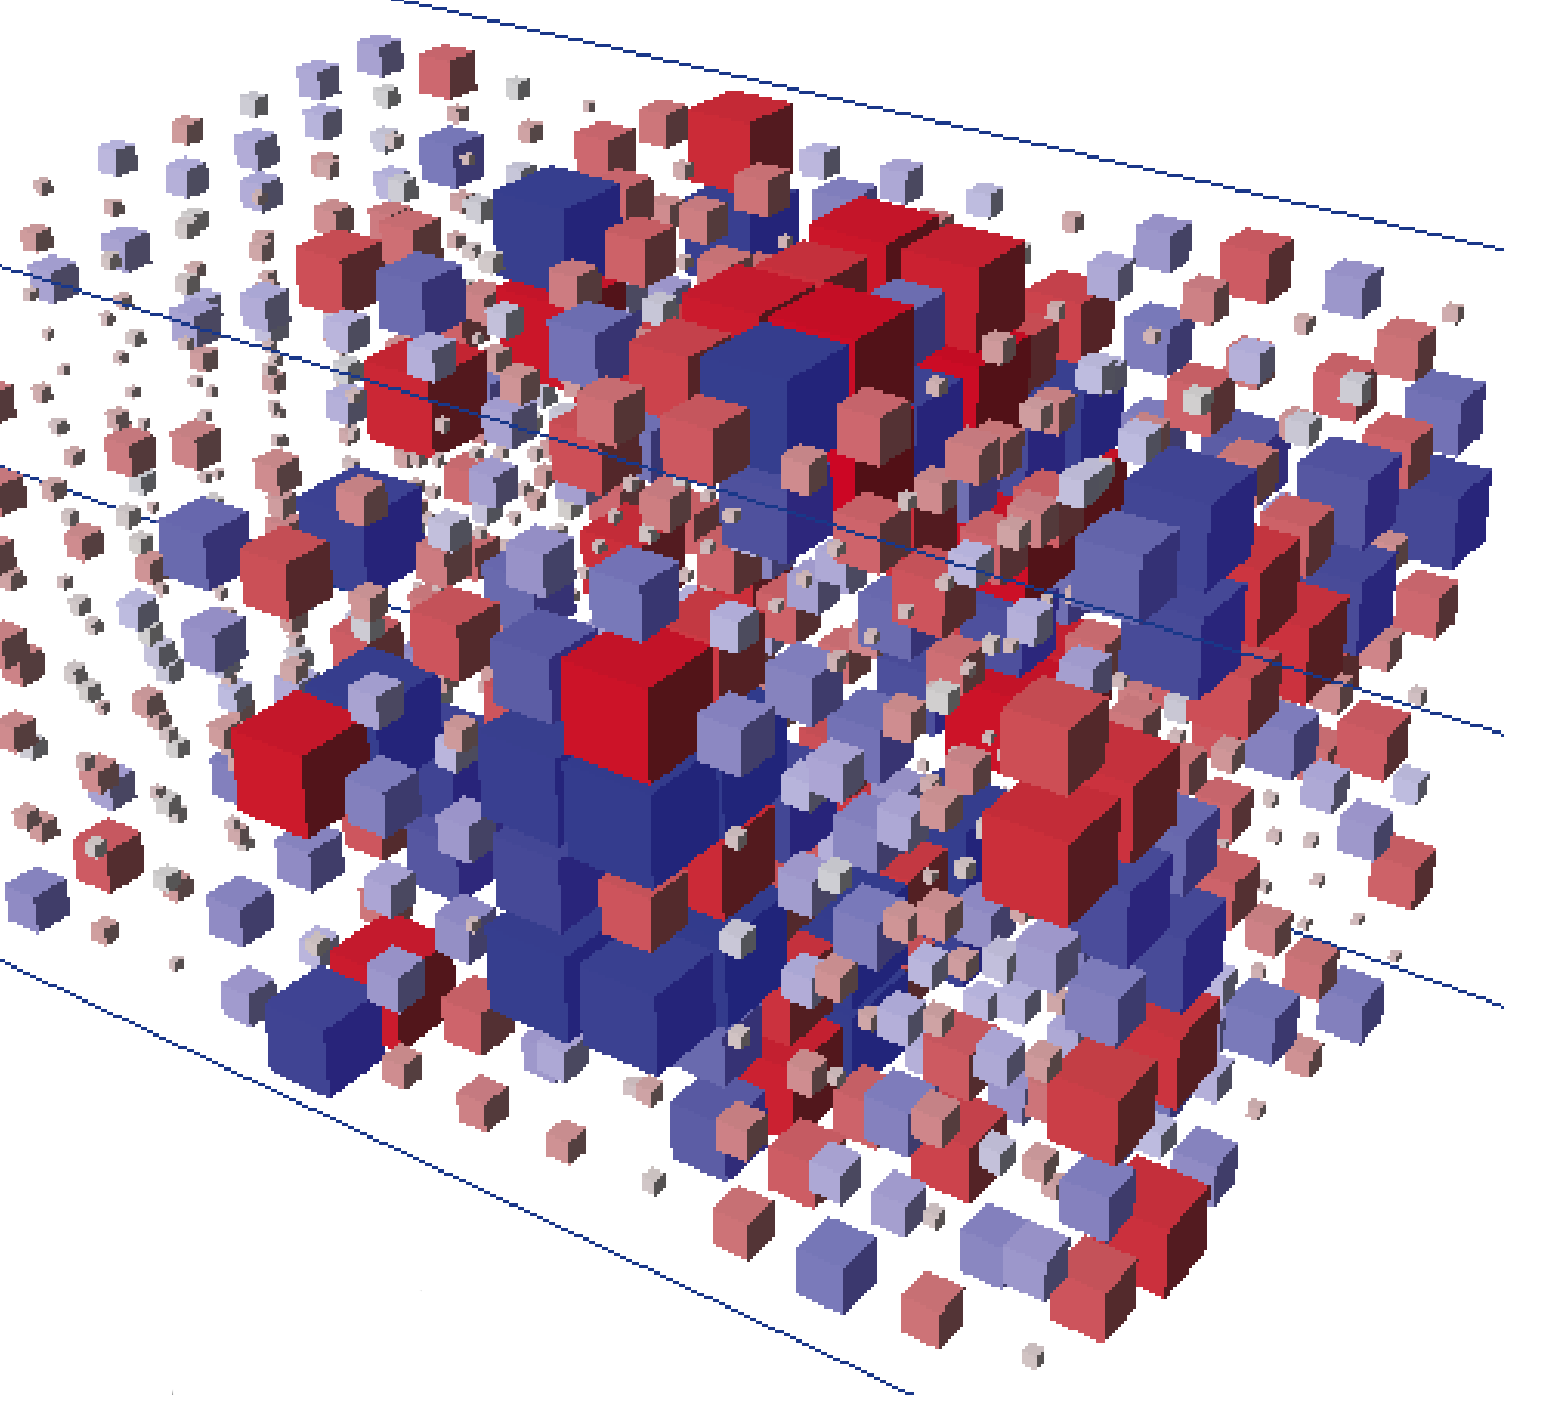
| 34 | 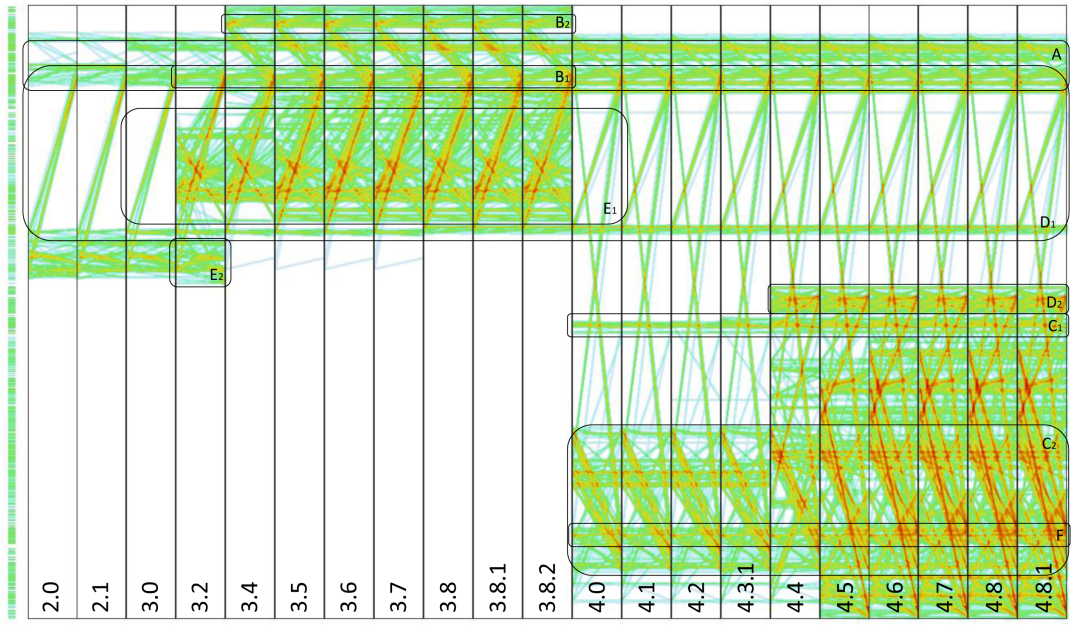 | Parallel Edge Splatting for Scalable Dynamic Graph Visualization Burch, Vehlow, Beck, Diehl, Weiskopf (2011) | | 35 | 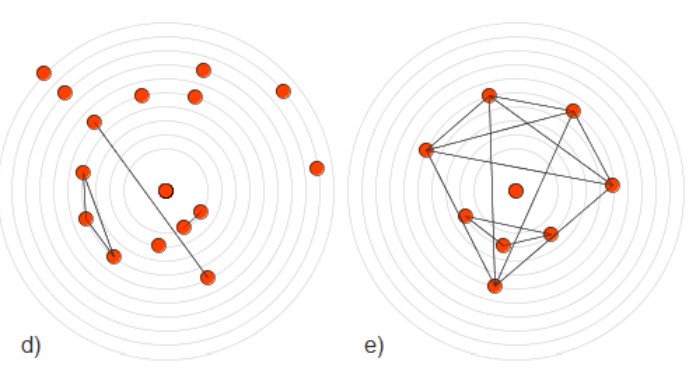 | Exploring temporal ego networks using small multiples and tree-ring layouts Farrugia, Hurley, Quigley (2011)   | |
|
| 38 | 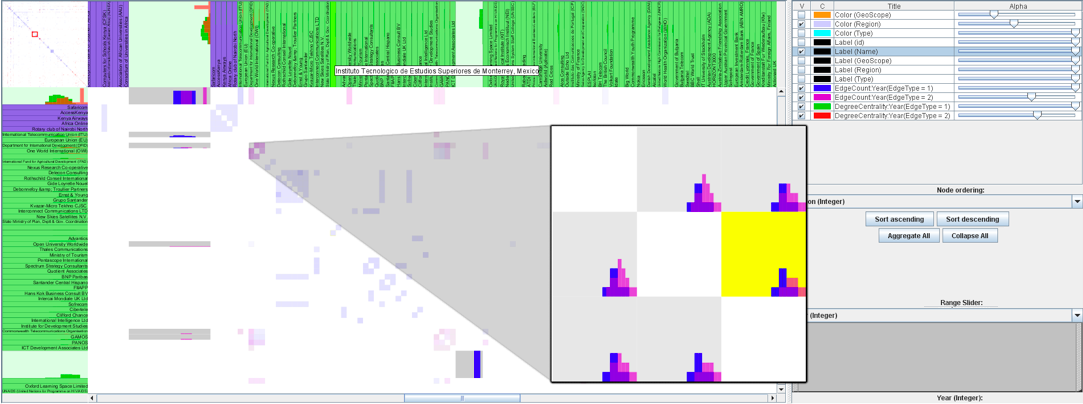 | TimeMatrix: Visualizing temporal social networks using interactive matrix-based visualizations Yi, Elmqvist, Lee (2010)  | |
|
|
|
| 43 | 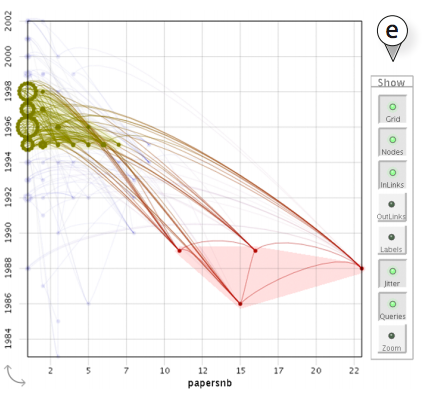 | GraphDice: A System for Exploring Multivariate Social Networks Bezerianos, Chevalier, Dragicevic, Elmqvist, Fekete (2010) | |
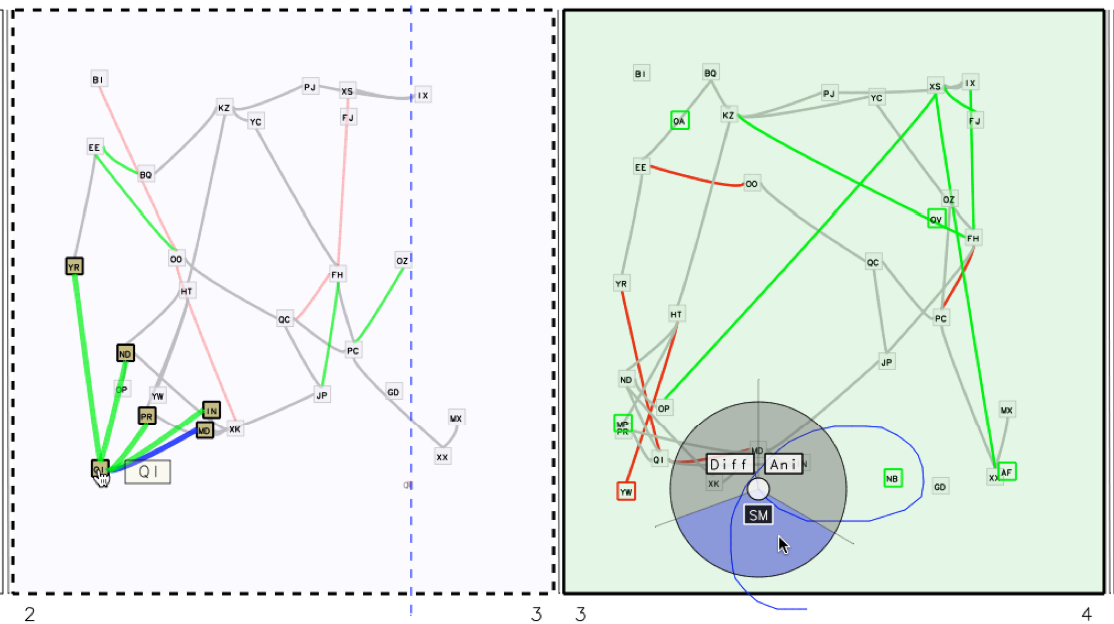
| 45 |  | Difference Map Readability for Dynamic Graphs Archambault, Purchase, Pinaud (2010)  | |
|
|
|
|
|
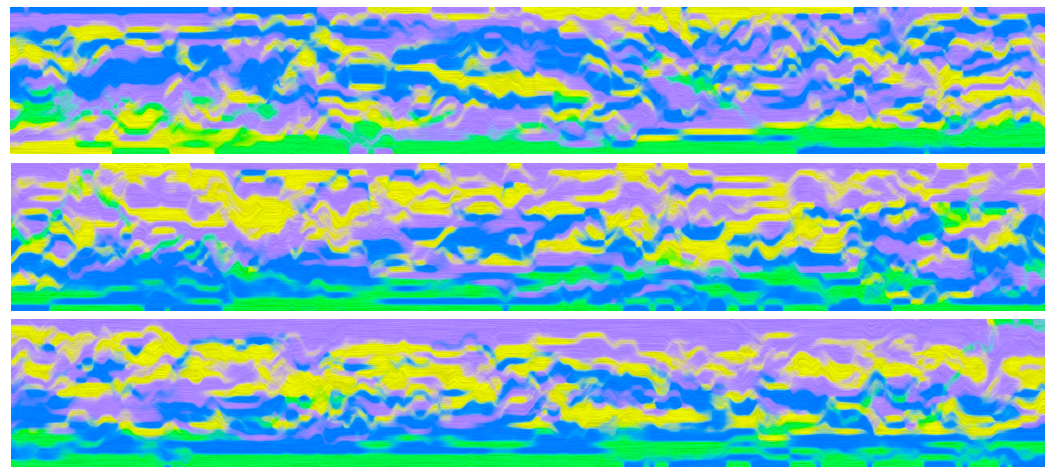
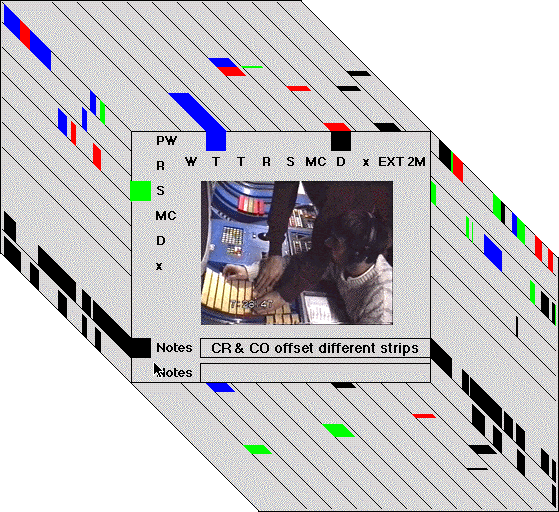
| 52 | 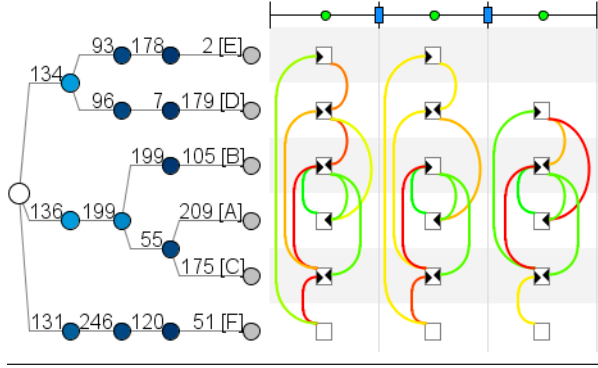 | Visualizing the Evolution of Compound Digraphs with TimeArcTrees Greilich, Burch, Diehl (2009) | | 53 | 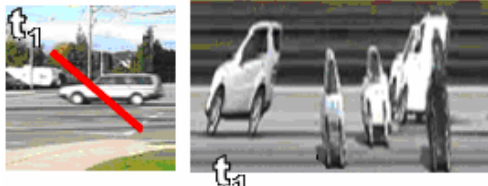 | Exploring Video Streams using Slit-Tear Visualizations Tang, Greenberg, Fels (2008) | |
| 55 | 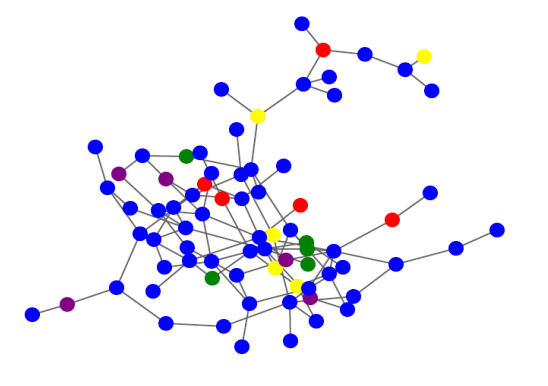 | The Mental Map versus Static Aesthetic Compromise in Dynamic Graphs: A User Study Saffrey, Purchase (2008) | |
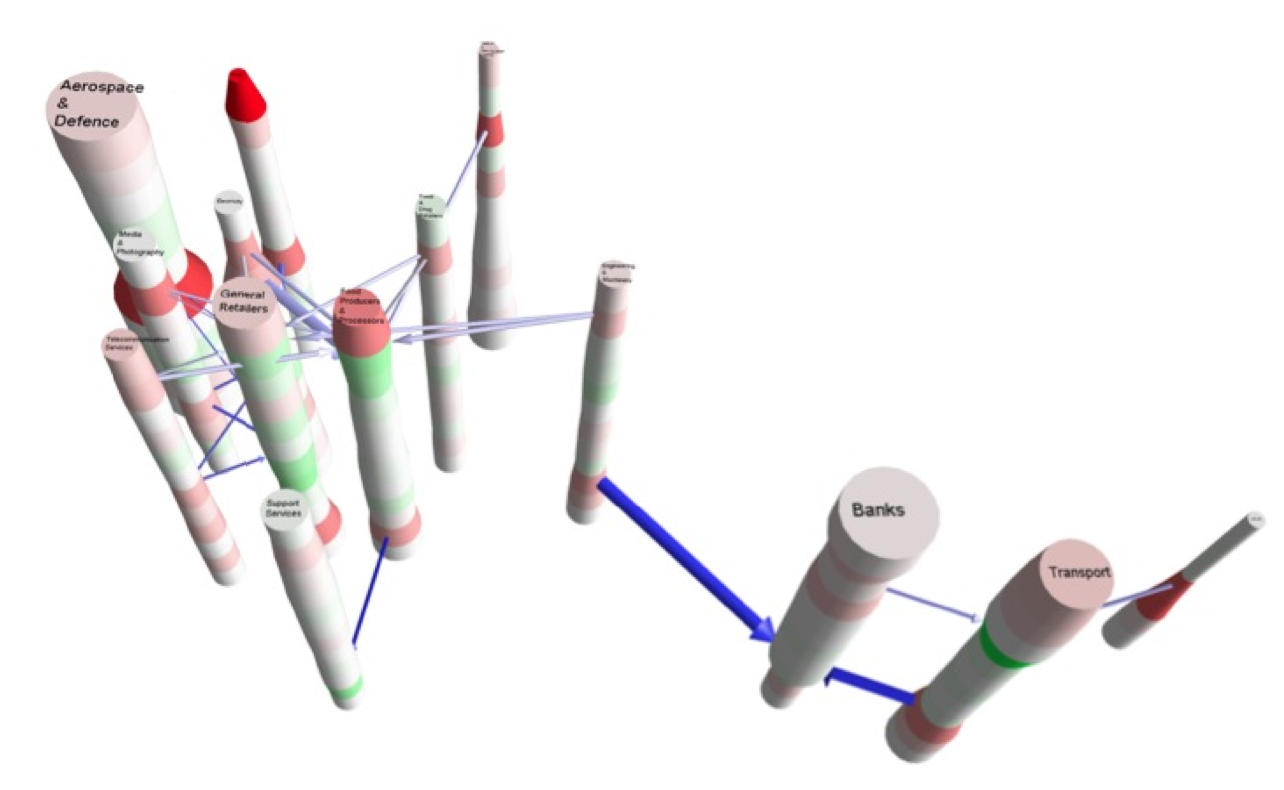
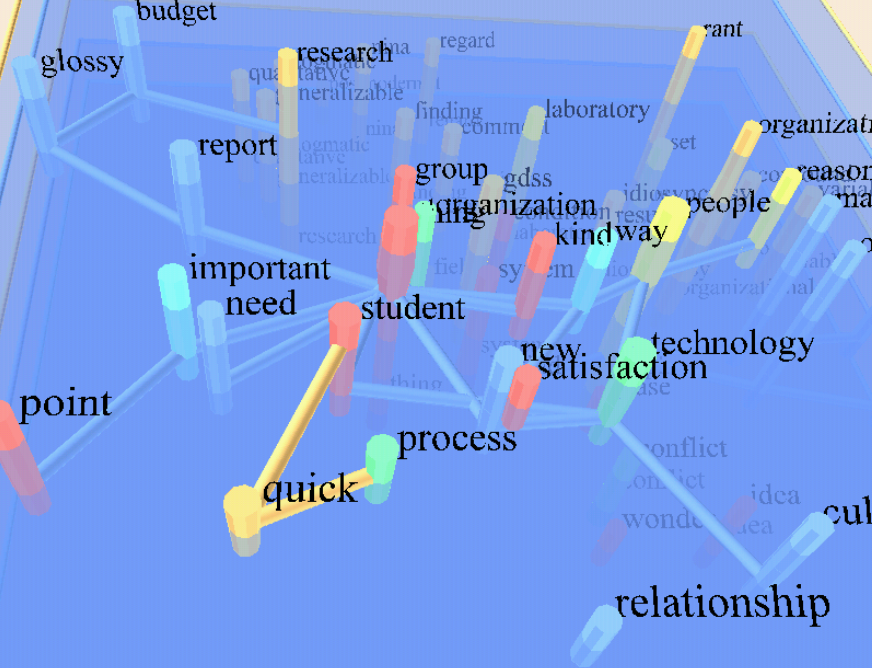
| 57 |  | Mining and Visualizing the Evolution of Subgroups in Social Networks Falkowski, Bartelheimer, Spiliopoulou (2006) | | 58 |  | Network Visualization by Semantic Substrates Aris, Shneiderman (2006) | |
| 60 | 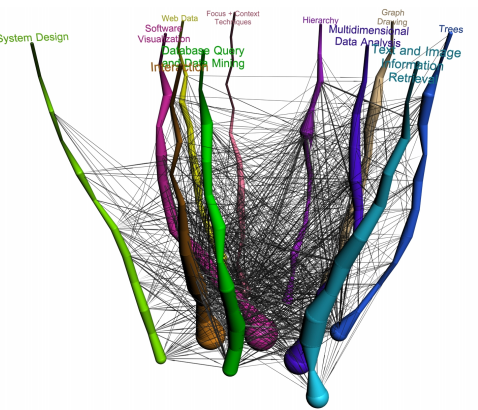 | Visualisation and Analysis of Large and Complex Scale-free Networks Ahmed, Dywer, Hong, Murray, Song, Wu
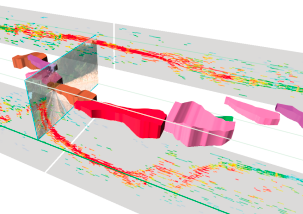
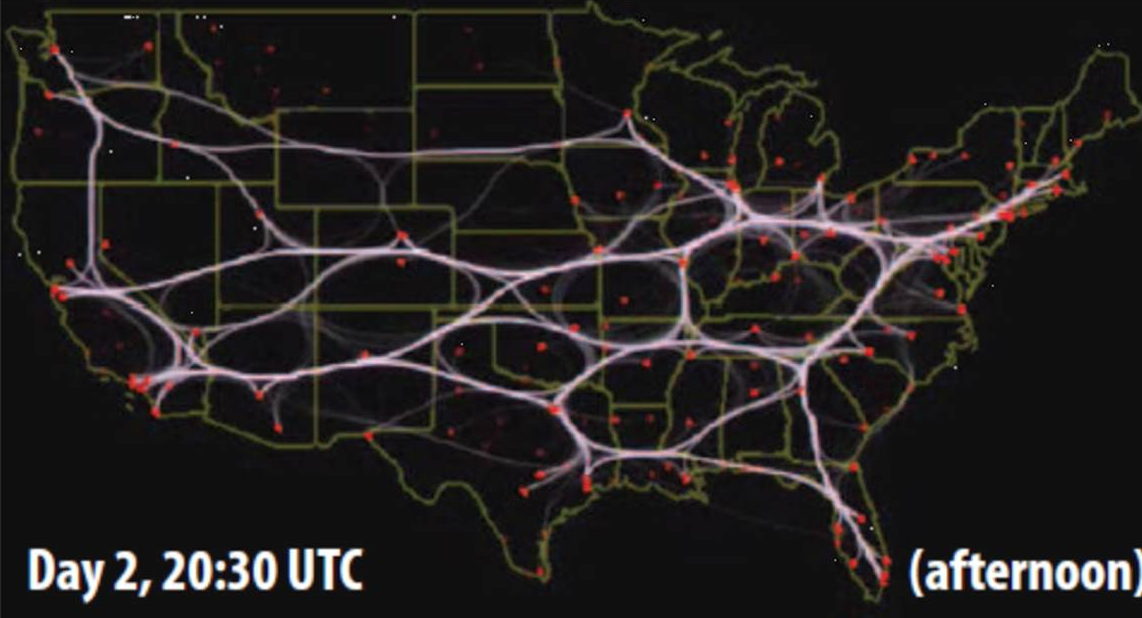
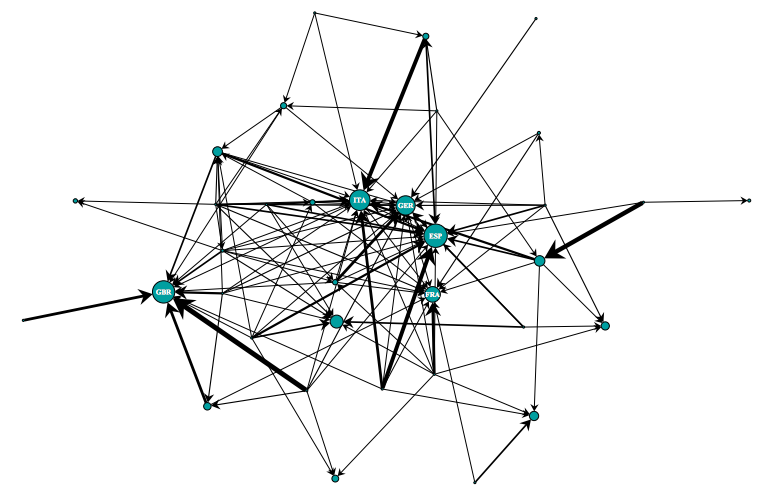
(2005)   | | 61 | 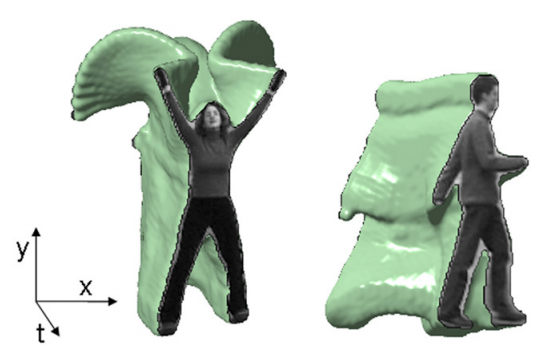 | Actions as Space-Time Shapes Gorelick, Blank, Shechtman, Irani, Basri (2005)  | | 62 | 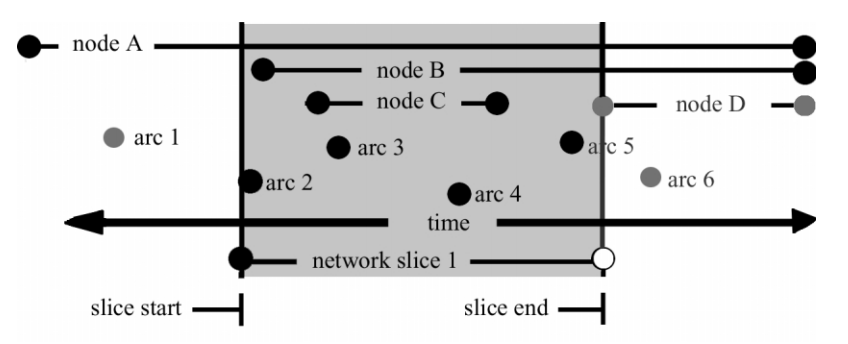 | Dynamic Network Visualization Moody, McFarland, Bender-deMoll (2005) | |
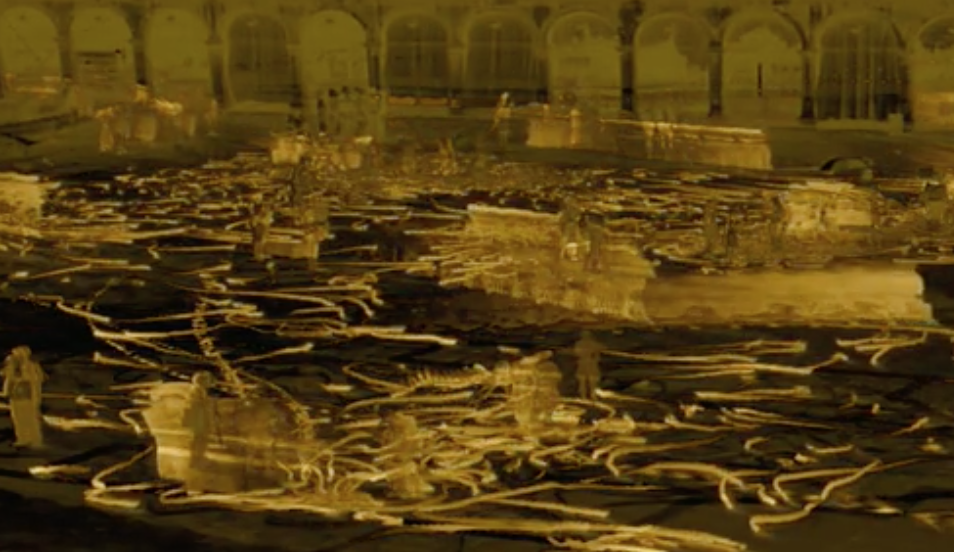
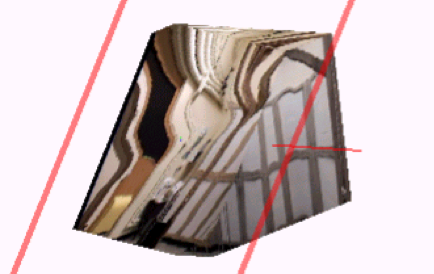
| 64 | 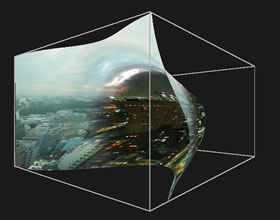 | Khronos Projector Cassinelli (2005)  | |
|
|
|
|
|
|
|
|
|
|
| 76 | 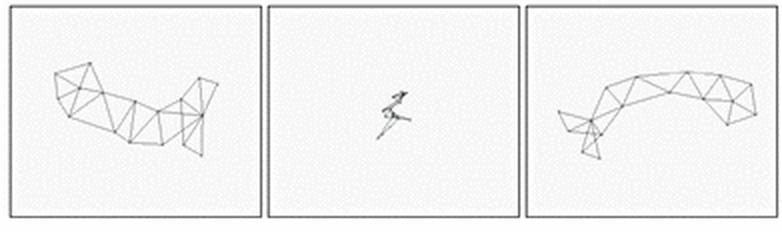 | Graph Drawing in Motion Friedrich, Eades (2002) | |
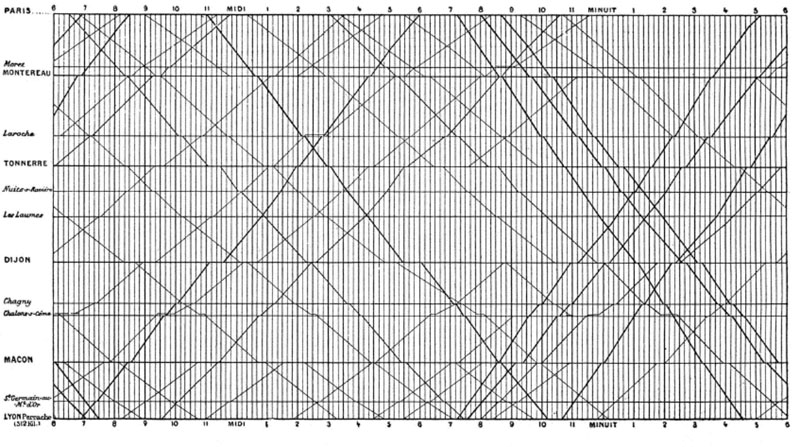
| 78 |  | The Marey Graph Animation Tool Demo Friedrich, Eades (2001) | |
|
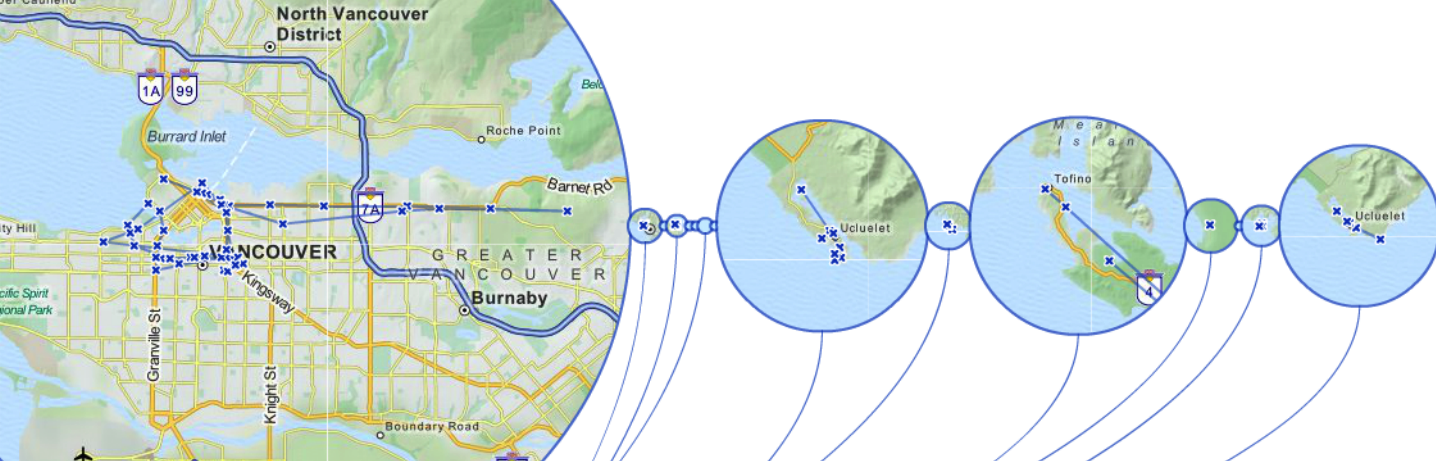
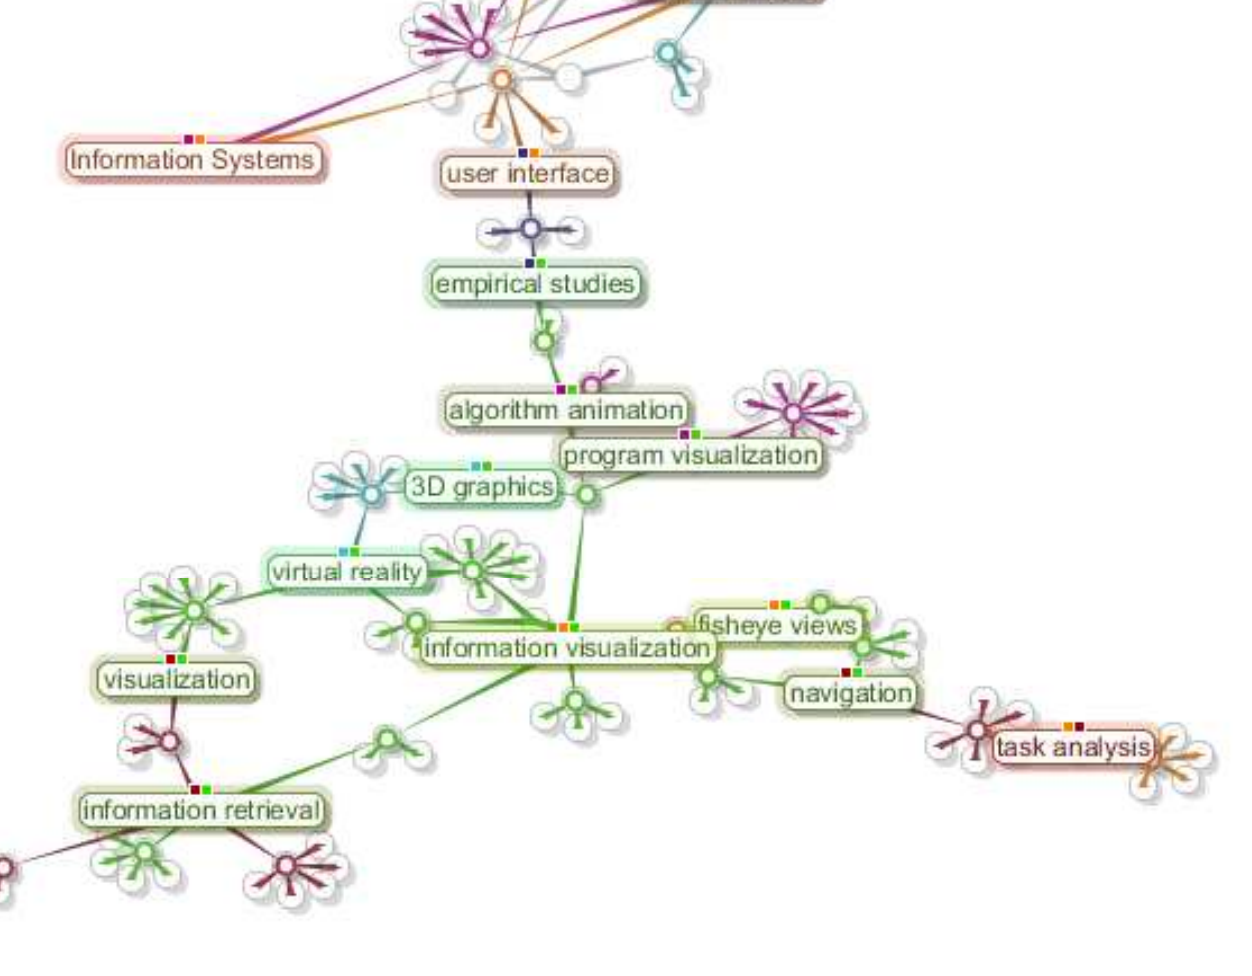
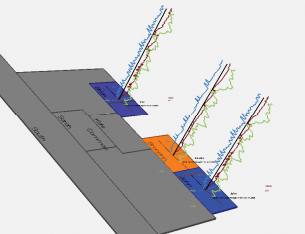
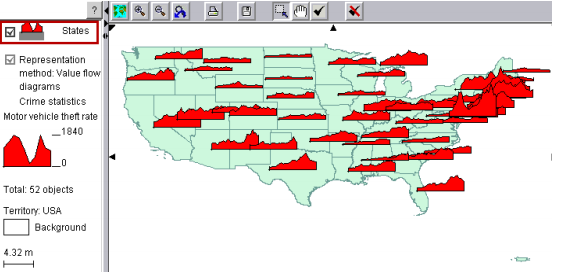
| 81 | 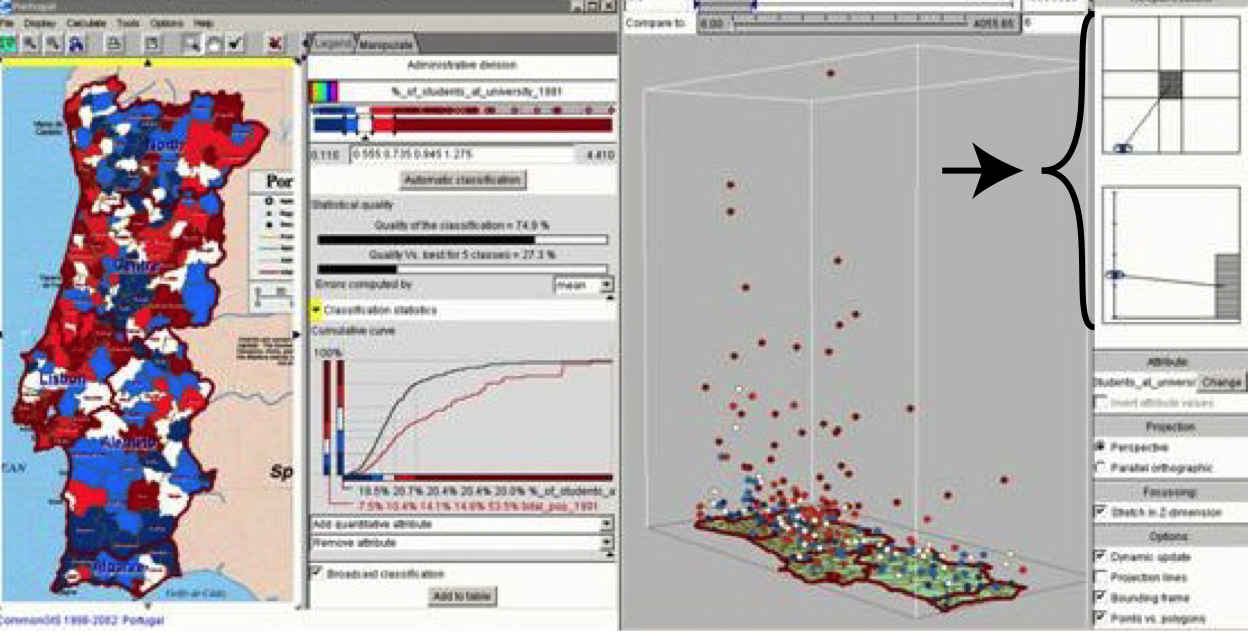 | Making a GIS intelligent: CommonGIS project view Andrienko, Andrienko (1999)  | |
|
|
| 85 |  | Nude Descending a Staircase, No. 2 Duchamp (1912) | |
| 87 |  | Chronophotography Marey (1880) | | 88 | 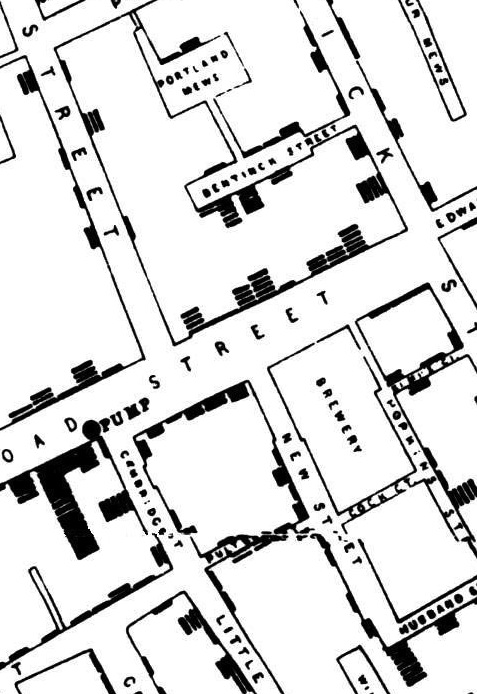 | London Cholea Outbreak 1854 Snow (1854) | | 89 | 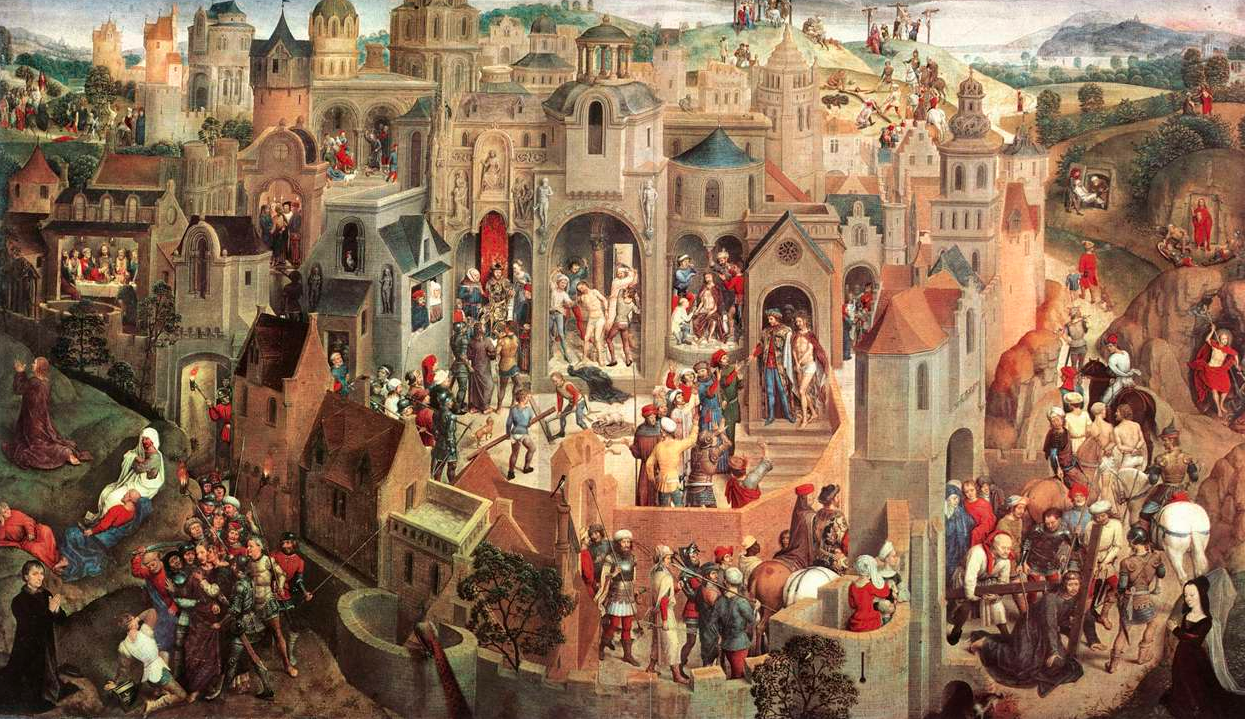 | Scenes from the Passion of Christ Memling (1471) |
| Filter:Show all (89)
|


 Planar-curvilinear-drilling (0)
 Oblique-cutting (0)
 Curvilinear-space-chopping (0)
 Non-planar-flattening (0)
 Space-interpolation (0)
 Volume-interpolation (0)
 Time-labeling (0)