Blinded with Science or Informed by Charts?
Experimental Material
This page contains experimental material for the VIS 2017 paper Blinded with Science or Informed by Charts? A Replication Study.
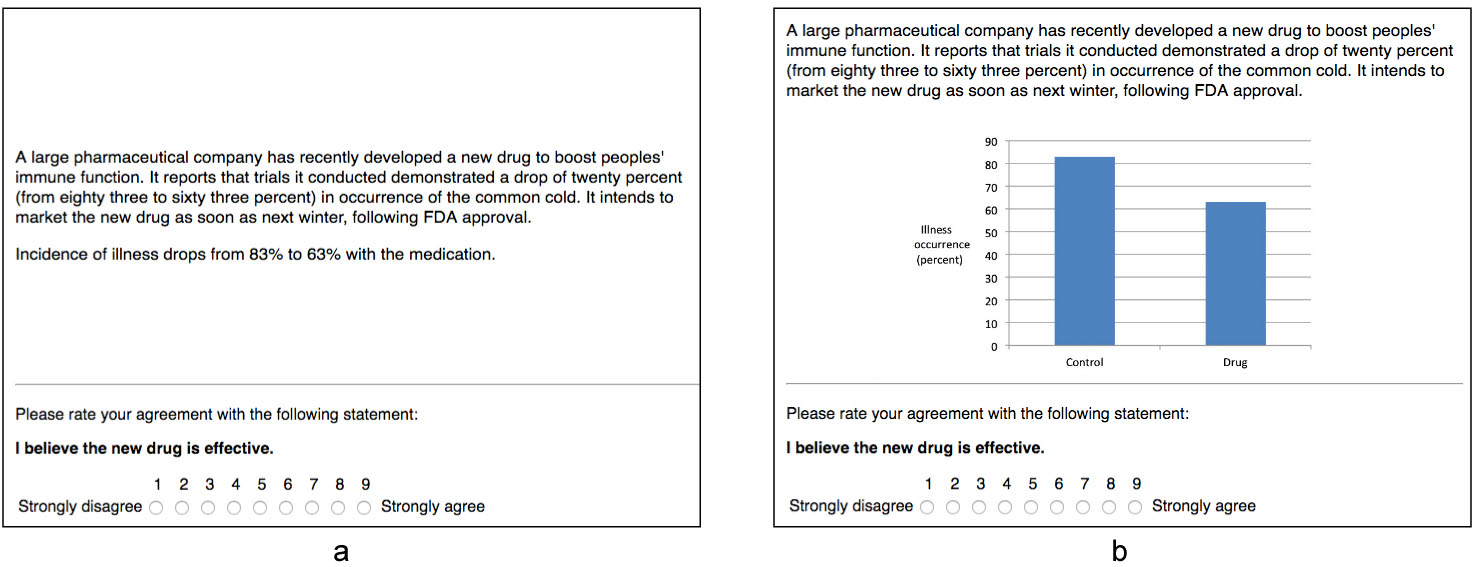
The paper is a reappraisal of Tal and Wansink’s 2014 study Blinded with Science: Trivial graphs and formulas increase ad persuasiveness and belief in product efficacy, where seemingly trivial charts were shown to increase belief in drug efficacy, presumably because charts are associated with science. Through a series of four replications conducted on two crowdsourcing platforms, we investigate an alternative explanation, namely, that the charts allowed participants to better assess the drug’s efficacy. Considered together, our experiments suggest that the chart seems to have indeed promoted understanding, although the effect is likely very small. Meanwhile, we were unable to replicate the original study’s findings, as text with chart appeared to be no more persuasive – and sometimes less persuasive – than text alone. This suggests that the effect may not be as robust as claimed and may need specific conditions to be reproduced. Regardless, within our experimental settings and considering our study as a whole (N = 623), the chart’s contribution to understanding was clearly larger than its contribution to persuasion.
You can watch the conference talk on vimeo.
We created this page in 2017. In 2021, we created an OSF repository where we put most of the material available here, and more: https://osf.io/zh3f4/. Here you can however try the experiment directly in your browser, and view the data analyses in a notebook format, which is not possible with the OSF repository.
- Authors: Pierre Dragicevic and Yvonne Jansen
- Licence: Creative Commons CC-BY International 4.0. Please cite our article if you reuse any of this material.
- Last updated: 29 September 2017
For any information feel free to drop us an email.
Experiment Stimuli
You can go through all of our experiments by clicking on the links below.
- Experiment 1
- Experiment 2
- Experiment 3
- Experiment 4
Data and analysis scripts
- Analyses of our data in Markdown format.
- Reanalyses of the original study in Markdown format.
- Zip file containing the experimental datasets and R scripts. Please see README.txt for instructions.
Experiment software
The experiment software was coded in HTML, PHP and Javascript. It is available on github in the demo version linked to above, that is, all manipulation checks are deactivated.
