Visual Analytics for Monitoring and Exploration of Blockchain Data
With a Focus on the Bitcoin Blockchain


Two example systems under development in our lab
Thesis Topic
Blockchain technology was originally invented to support recordkeeping of financial transactions that are sent and received without any central intermediary. The Bitcoin blockchain, for example, is the heart of the Bitcoin system. It represents a public ledger in which all transactions between pseudonymous users are registered, validated, maintained, and distributed across the entire network of users [ BMC + 15 , Nak08 ]. It can only be added to, and past finanancial transactions stored in the blockchain cannot be changed. Blockchains, such as the Bitcoin blockchain, thus constantly grow and offer a unique opportunity to study the evolution of the stored data as well as the interactions of the user adding data to the blockchain. The goal of this PhD topic is to devise visual analytics techniques to deeply explore data stored on blockchains. We will focus on long-term activities and monitoring: effects that cover the entire blockchain or that are recent and different from what happened in the past, to try to understand what activities people ( = actors) exhibit on the blockchain. Long-term effects are more informative about behaviors of actors on the blockchain than behavioral patterns extracted from short temporal snippets, but these short temporal snippets can be interpreted in perspective with the whole activity. There are several questions and tasks that the research tools will target:
- How has the activity on the blockchain changed over the years?
- What is the general behavior of blockchain actors? E.g. can we identify groups of actors based on the stored data associated to them?
- How do external events influence the activity on the blockchain?
- How do internal events (e.g. security issues, fraud, etc.) influence the activity on the blockchain?
- How does activity on two different blockchains relate?
In particular, the work will begin with a focus on the Bitcoin blockchain as the oldest blockchain with a turbulent history. Currently, the raw data alone contains over 175 million transactions ( > 100 GB of raw data) and is constantly growing. Visualizing this many transactions requires techniques that work on multiple levels of data aggregation. We need to provide complete overviews of the network and also allow analysts to interactively drill down and see close details of transactions or individual actors on the network. The work will later explore other blockchains, such as Ethereum or consortium blockchains when data is available. We will conduct our research in collaboration with economists and consortium blockchain managers. Economists want to understand the activities on the blockchains and compare them with related economic activities in the real world. Consortium blockchain managers need to understand how their blockchain evolves, according to their plans and how it compares to other blockchains.
Past Work
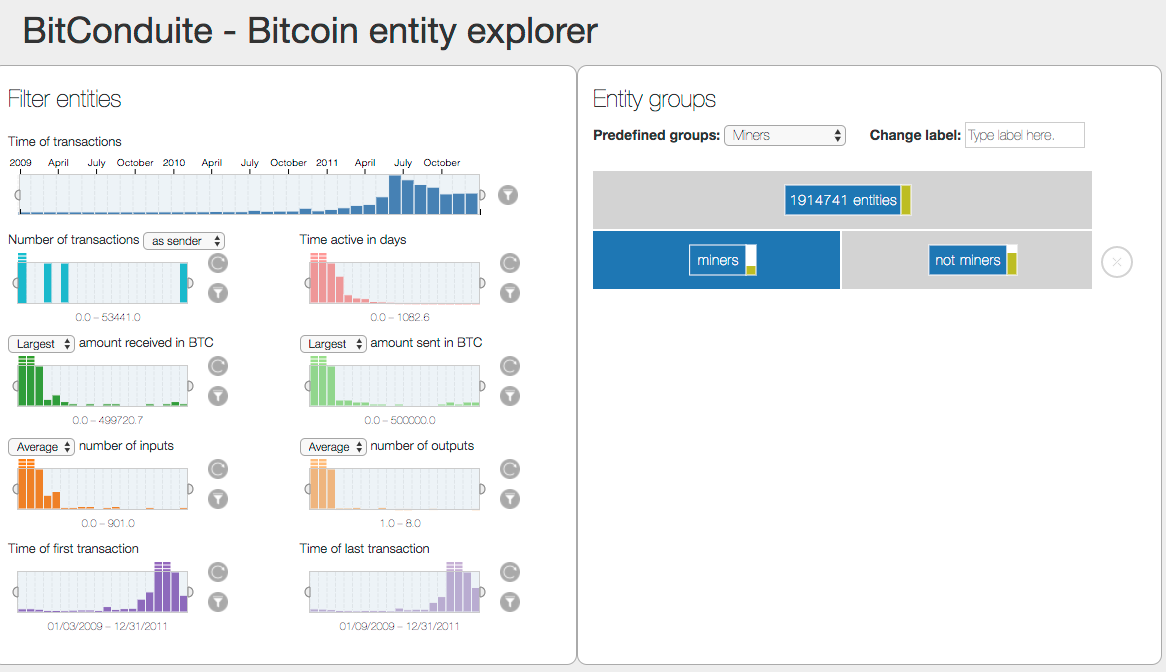
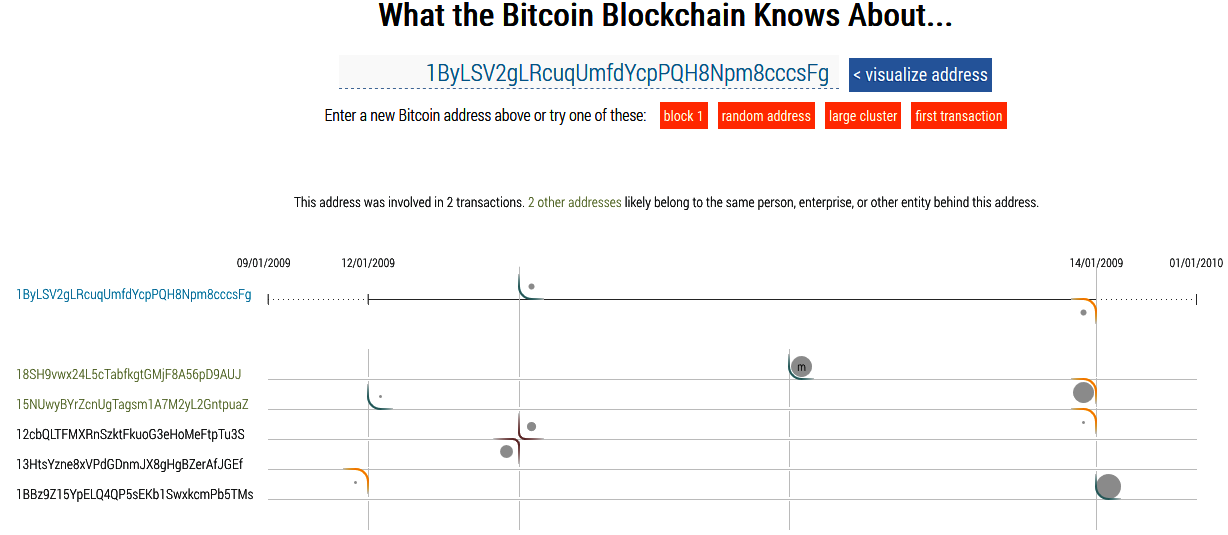
The work will build on our existing work on Bitcoin visual analytics. We have so far developed two tools: BitConduite [ KFI17 ] is a system for the visual exploration of financial activity on the Bitcoin network. BitConduite offers a data transformation back end that gives us an entity-based access to the blockchain data and a visualization front end that supports a high-level view on transactions over time. In particular, it facilitates the exploration of activity through filtering and clustering interactions. The system was developed with experts in economics and a first user study was conducted. The extension of the system will be a first step of the PhD research. In particular, information on external events and external data (such as the price development) is still missing. The Bitcoin Entity Explorer [ IKF17 ] is a visual exploration system for analyzing the behavior of individual actors exchanging Bitcoins. Bitcoin addresses belong to individual actors such as people, services, or enterprises. Understanding how the Bitcoin system is used, however, is difficult because it is unclear which addresses belong to the same entities. Our tool addresses this problem by clustering addresses and displaying transaction detail for individual entities. The Bitcoin Entity Explorer will be connected to Bitonduite for an analysis on multiple levels of detail.
Thesis Details
- Title: Visual Analytics for Monitoring and Exploration of Blockchain Data
- Place: The student will work jointly at SystemX and Inria Saclay at the Digiteo Moulon Site
- Funding: The funding source will be provided through a grant by IRT SystemX
- Supervisors: Jean-Daniel Fekete, Petra Isenberg (Inria) and Nicolas Heulot (SystemX)
- Contact: petra.isenberg@inria.fr
- Starting Date: Ideally September 2018