An Interaction Model for Visualizations Beyond the Desktop
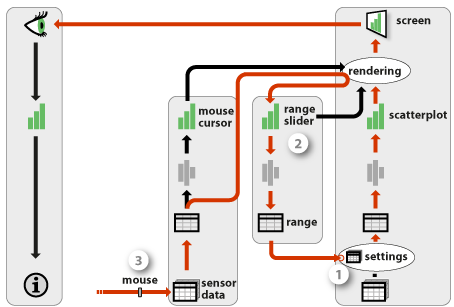
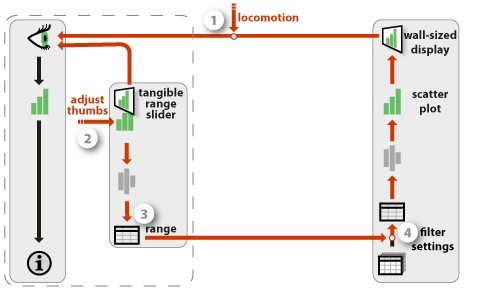
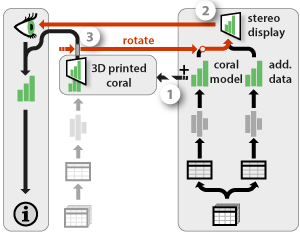
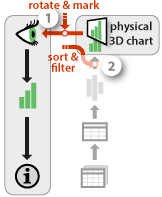
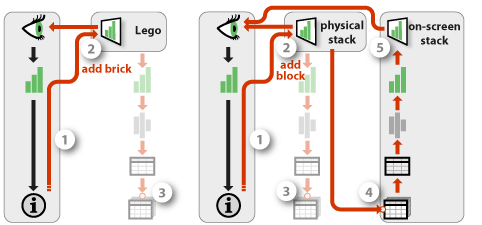
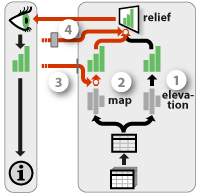
Examples of beyond-desktop interactive visualizations: a) tangible range sliders for wall-sized displays, b) a rearrangeable physical 3D chart,
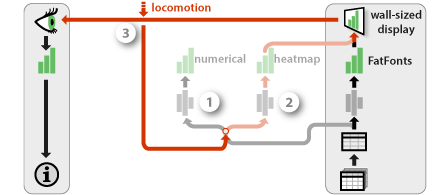
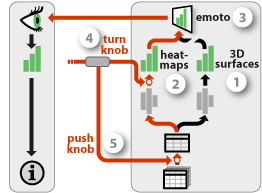
c) an interactive data sculpture of time series, d) an interactive shape-changing display.
We present an interaction model for beyond-desktop visualizations that combines the visualization reference model with the instrumental interaction paradigm. Beyond-desktop visualizations involve a wide range of emerging technologies such as wall-sized displays, 3D and shape-changing displays, touch and tangible input, and physical information visualizations. While these technologies allow for new forms of interaction, they are often studied in isolation. New conceptual models are needed to build a coherent picture of what has been done and what is possible. We describe a modified pipeline model where raw data is processed into a visualization and then rendered into the physical world. Users can explore or change data by directly manipulating visualizations or through the use of instruments. Interactions can also take place in the physical world outside the visualization system, such as when using locomotion to inspect a large scale visualization. Through case studies we illustrate how this model can be used to describe both conventional and unconventional interactive visualization systems, and compare different design alternatives.
Article
Yvonne Jansen and Pierre Dragicevic (2013). An Interaction Model for Visualizations Beyond the Desktop. IEEE Transactions on Visualization and Computer Graphics, 19 (12), pp. 2396 - 2405.
Slides (pdf) of the presentation at IEEE VIS 2013.
Additional Material
You can download the elements of our visual notation in their original vector graphics format (SVG) by clicking on the images below.
Alternatively, you can download:
- A ZIP of all SVG files
- All figures in a single Adobe Illustrator file
- All figures in a single PDF file
All material on this page is CC-BY-SA. If you reuse or adapt these graphics please reference our article above and/or link to this page.
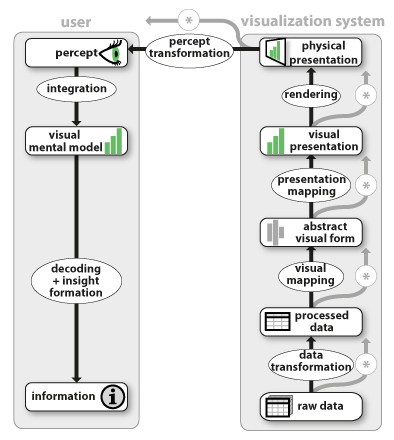 |  |
| The extented infovis pipeline (Fig 2) | A horizontal version of our extended infovis pipeline |
 |
| Elements of our visual notation (Fig 3) |
More on Physical Visualizations
Also see our previous empirical study of physical visualizations, and our list of physical visualizations.
Contact
- Yvonne Jansen - Université Paris-Sud, INRIA
- Pierre Dragicevic - INRIA


