Progressive Data Analysis

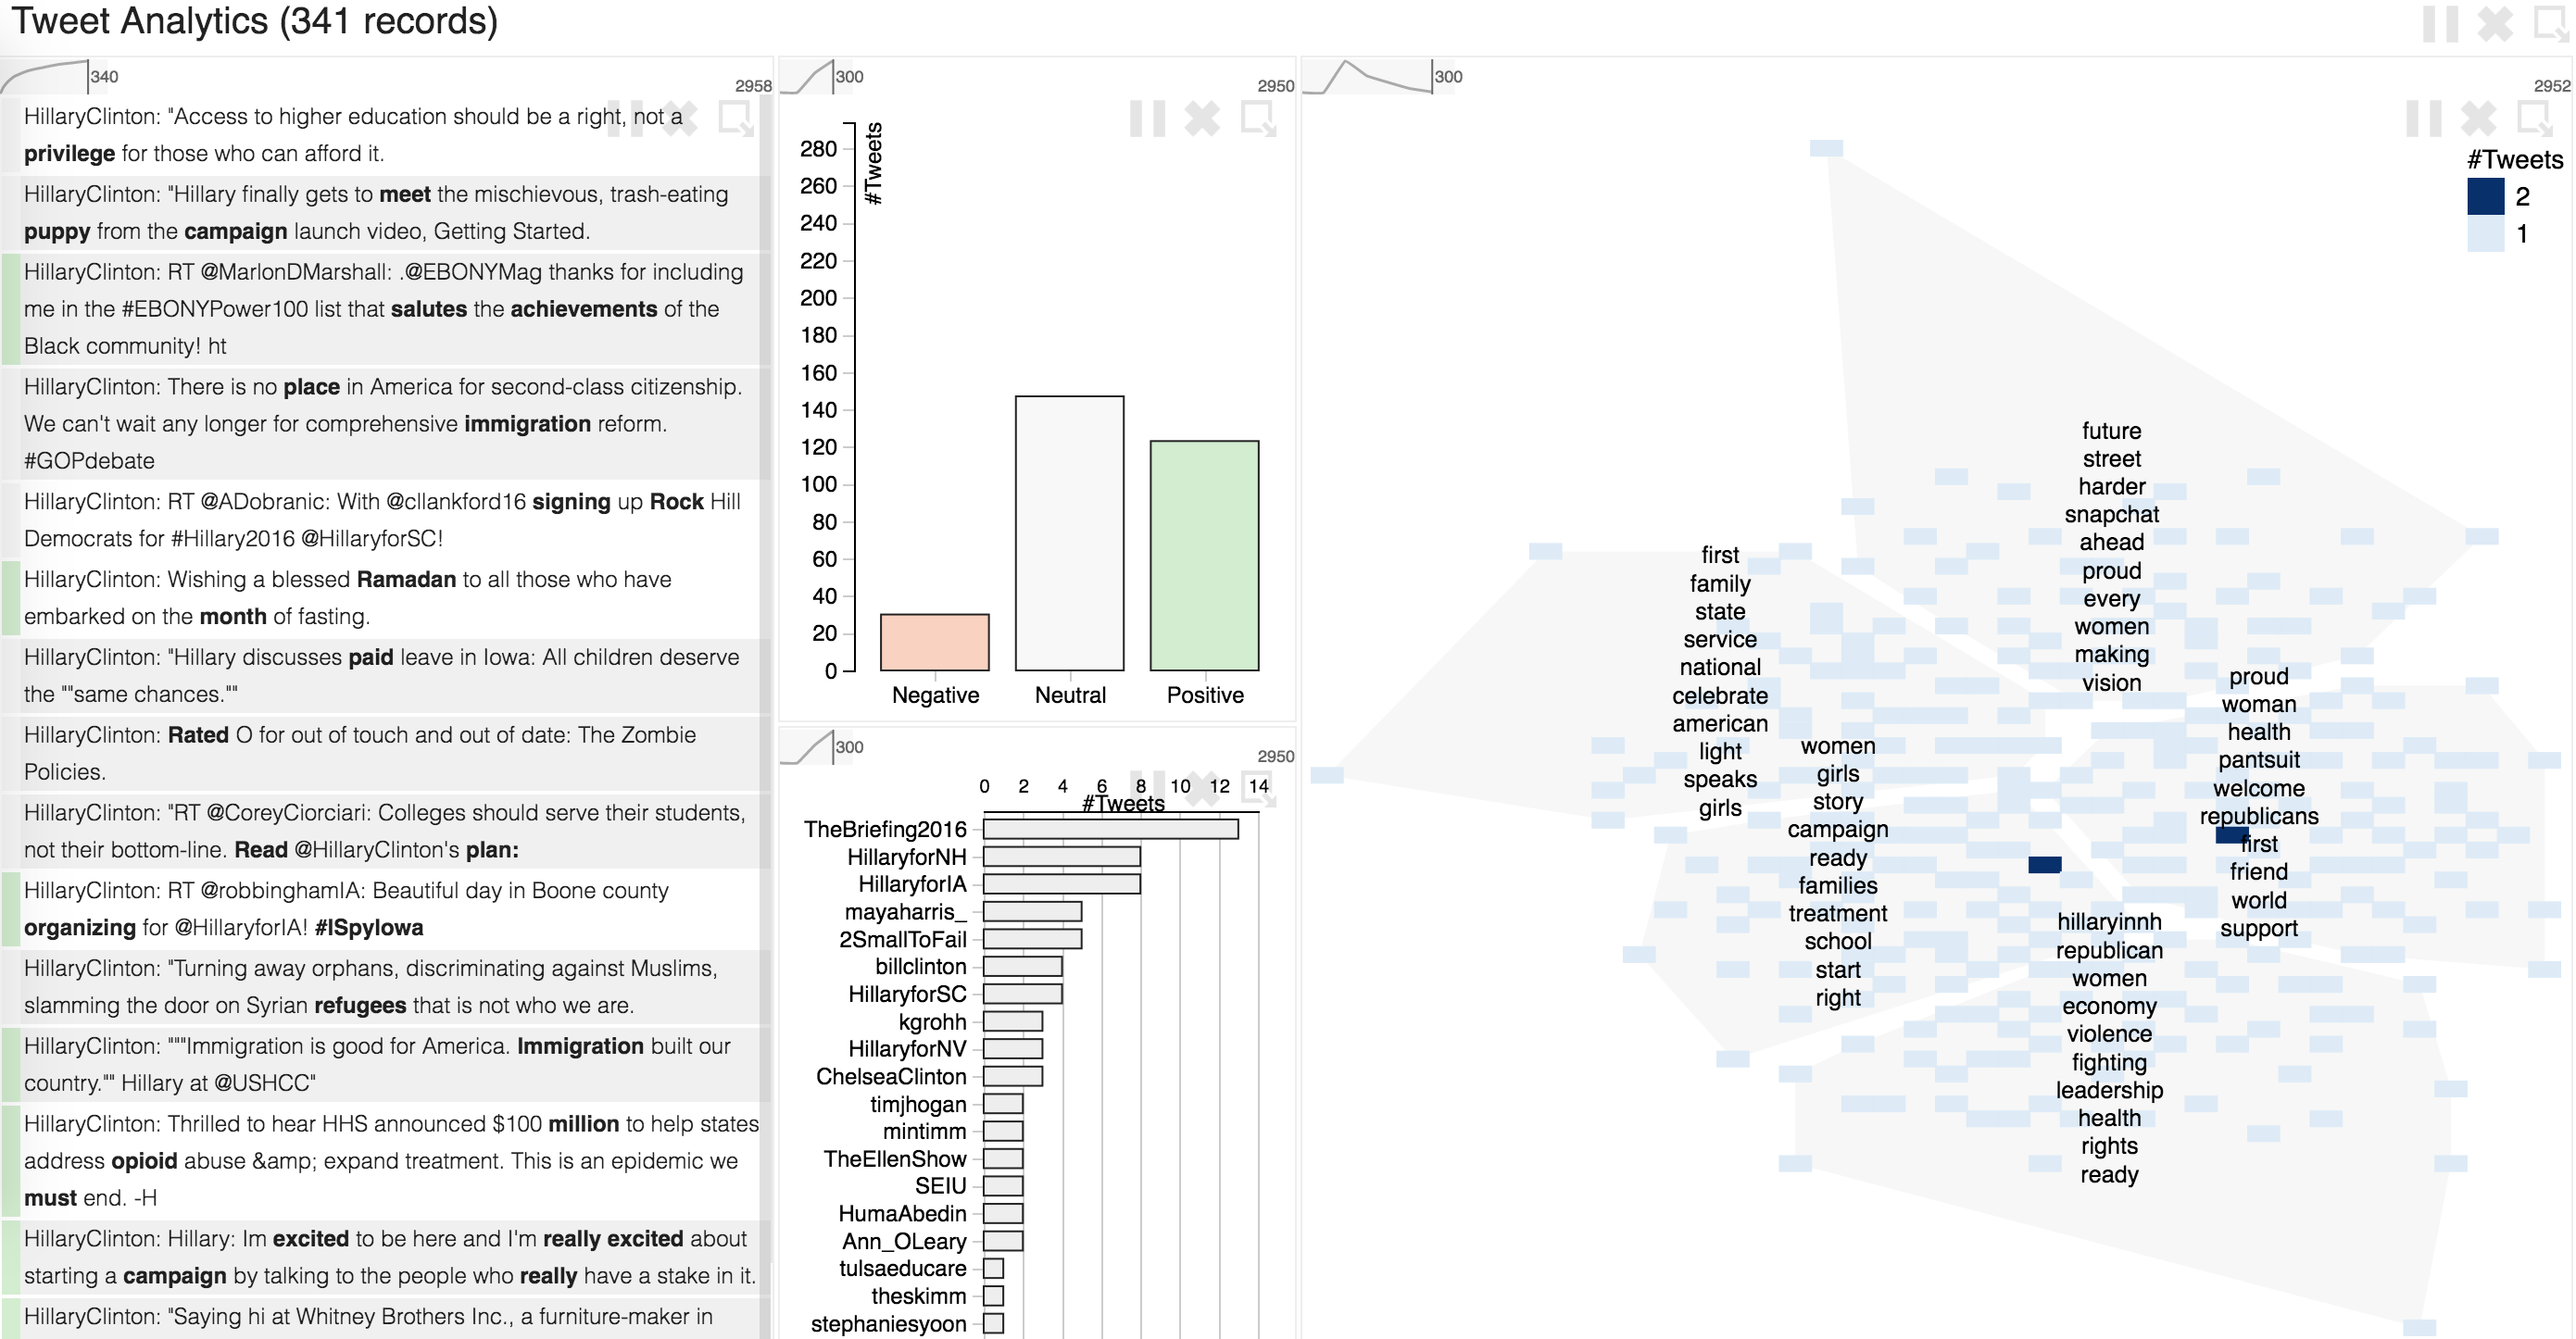
Our civilization is collecting data at a pace never seen before. While data analysis has made tremendous progresses in scalability in the last decade, this progress has only benefited “confirmative” analysis or model-based computation; progress in data exploration has lagged behind. The main reason is that, to maintain their efficiency during exploration, humans need a rapid feedback loop of about 10 seconds. However, when data becomes larger or algorithms more complex, bounding the latency is not possible with existing computation paradigms. To address this problem, recent research have proposed an approach called Progressive Visual Analytics (PVA). Instead of performing the whole computation in one long step, PVA quickly generates estimates of the results and updates them continuously to allow the analyst to 1) monitor progress, usually with data visualizations, 2) steer algorithms by interactively adjusting parameters while the computation is performed, and 3) control the process (start, stop, resume).
Our objective is to explore this new field of research. We are studying it with multiple facets, both from the human side, and from the machine side.
For more details and inspiration for research, see our book Progressive Data Analysis: Roadmap and Research Agenda
Events
We organized several events related to progressive data analysis and visualization and will organize more of them. They will be announced here.
- IEEE VIS Workshop on Progressive Data Analysis and Visualization, with Alex Ulmer, Jaemin Jo, and Michael Sedlmair, St. Pete Beach, Florida, Oct. 14, 2024.
- EuroVA session on Progressive Data Analysis at EuroVA 2024, Odense, DK, May 27th, 2024
- Dagstuhl Seminar Progressive Data Analysis and Visualization, with Danyel Fisher, Arnab Nandi, and Michael Sedlmair, Seminar 18411, Dagstuhl, Germany, Oct. 2018
Publications
We are actively working on progressive data analysis and visualization and published several articles and a book.
- Jean-Daniel Fekete, Danyel Fisher, and Michael Sedlmair, Progressive Data Analysis: Roadmap and Research Agenda , Eurographics Association, ISBN: 978-3-03868-270-7, (10.2312/pda.20242707, Nov. 2024 (Web page)
- Alex Ulmer, Marco Angelini, Jean-Daniel Fekete, Jörn Kohlhammer, Thorsten May. A Survey on Progressive Visualization. IEEE Transactions on Visualization and Computer Graphics, inPress, 30, pp.6447 - 6467. ⟨10.1109/TVCG.2023.3346641⟩. ⟨hal-04361344⟩
- Ameya Patil, Gaëlle Richer, Christopher Jermaine, Dominik Moritz, Jean-Daniel Fekete. Studying Early Decision Making with Progressive Bar Charts. IEEE Transactions on Visualization and Computer Graphics, Institute of Electrical and Electronics Engineers, In press, ⟨10.1109/TVCG.2022.3209426⟩. ⟨https://hal.inria.fr/hal-03738461v2⟩. (Web Page)
- Xin Chen, Jian Zhang, Chi-Wing Fu, Jean-Daniel Fekete, Yunhai Wang. Pyramid-based Scatterplots Sampling for Progressive and Streaming Data Visualization. IEEE Transactions on Visualization and Computer Graphics, Institute of Electrical and Electronics Engineers, inPress, ⟨10.1109/TVCG.2021.3114880⟩. ⟨https://hal.inria.fr/hal-03360776⟩
- Leilani Battle, Philipp Eichmann, Marco Angelini, Tiziana Catarci, Giuseppe Santucci, Yukun Zheng, Carsten Binnig, Jean-Daniel Fekete, Dominik Moritz. Database Benchmarking for Supporting Real-Time Interactive Querying of Large Data. SIGMOD ’20 - International Conference on Management of Data, Jun 2020, Portland, OR, United States. pp.1571-1587, ⟨10.1145/3318464.3389732⟩. ⟨https://hal.inria.fr/hal-02556400⟩ (Web page)
- Jaemin Jo, Jinwook Seo, Jean-Daniel Fekete, PANENE: A Progressive Algorithm for Indexing and Querying Approximate k-Nearest Neighbors, IEEE Transactions on Visualization and Computer Graphics, Institute of Electrical and Electronics Engineers, 2020, 26 (2), pp.1347-1360. ⟨10.1109/TVCG.2018.2869149⟩. (https://hal.inria.fr/hal-01855672) (Web page)
- Jean-Daniel Fekete, Danyel Fisher, Arnab Nandi, Michael Sedlmair. Progressive Data Analysis and Visualization. Oct 2018, Wadern, Germany. Schloss Dagstuhl--Leibniz-Zentrum fuer Informatik, 2019, ⟨10.4230/DagRep.8.10.1⟩. ⟨https://hal.inria.fr/hal-02090121⟩ (Web page)
- Cagatay Turkay, Nicola Pezzotti, Carsten Binnig, Hendrik Strobelt, Barbara Hammer, Daniel A. Keim, Jean-Daniel Fekete, Themis Palpanas, Yunhai Wang, Florin Rusu. Progressive Data Science: Potential and Challenges. 2019. ⟨https://hal.inria.fr/hal-01961871⟩
- Jaemin Jo, Jinwook Seo, Jean-Daniel Fekete, A Progressive k-d tree for Approximate k-Nearest Neighbors, Workshop on Data Systems for Interactive Analysis (DSIA), Oct 2017, Phoenix, United States. <hal-01650272>
- Sriram Karthik Badam, Niklas Elmqvist, Jean-Daniel Fekete. Steering the Craft: UI Elements and Visualizations for Supporting Progressive Visual Analytics . Computer Graphics Forum, Wiley, 2017, Eurographics Conference on Visualization (EuroVis 2017), 36 (3), pp.12. ⟨10.1111/cgf.13205⟩.<hal-01512256>
- Emanuel Zgraggen, Alex Galakatos, Andrew Crotty, Jean-Daniel Fekete, Tim Kraska. How Progressive Visualizations Affect Exploratory Analysis. IEEE Transactions on Visualization and Computer Graphics, Institute of Electrical and Electronics Engineers, 2017, <10.1109/TVCG.2016.2607714>. <hal-01377896>
- Jean-Daniel Fekete, Romain Primet. Progressive Analytics: A Computation Paradigm for Exploratory Data Analysis. 2016. <<arXiv:1607.05162 <hal-01361430>
- Jean-Daniel Fekete. ProgressiVis: a Toolkit for Steerable Progressive Analytics and Visualization. 1st Workshop on Data Systems for Interactive Analysis, Oct 2015, Chicago, United States. pp.5, 2015, <http://www.interactive-analysis.org/>. <hal-01202901>
Software
Progressive data analysis is a new programming paradigm that requires new algorithms and programming constructs. We contribute to the community by distributing our software platforms in open source.
- The ProgressiVis Toolkit: a Python toolkit and scientific workflow system that implements a new programming paradigm that we call Progressive Analytics aimed at performing analytics in a progressive way. It allows analysts to see the progress of their analysis and to steer it while the computation is being done. (Web page) (Github repository)
- ParcoursVis/ParcroursURGE: a Python server and web front-end UI to support the visual analysis of medical temporal event sequences at scale. (Web page) (Gitlab repository)
Contact
For more information, contact Jean-Daniel Fekete.