Evolutionary Visual Exploration using EvoGraphDice
Evolutionary Visual Exploration (EVE) is a framework that combines visual analytics with stochastic optimisation to aid the exploration of multidimensional datasets characterised by a large number of possible views or projections. Starting from dimensions whose values are automatically calculated by a PCA, an interactive evolutionary algorithm progressively builds (or evolves) non-trivial viewpoints in the form of linear and non-linear dimension combinations, to help users discover new interesting views and relationships in their data. The criteria for evolving new dimensions is not known a priori and are partially specified by the user via an interactive interface:
- The user selects views with meaningful or interesting visual patterns and provides a satisfaction score.
- The system calibrates a fitness function (optimised by the evolutionary algorithm) to take into account the user input, and then calculates new views.
Our method leverages automatic tools to detect interesting visual features and human interpretation to derive meaning, validate the findings and guide the exploration without having to grasp advanced statistical concepts. To validate our method, we built a prototype tool (EvoGraphDice) as an extension of an existing scatterplot matrix inspection tool, and conducted an observational study with five domain experts. Our results show that EvoGraphDice can help users quantify qualitative hypotheses and try out different scenarios to dynamically transform their data. Importantly, it allowed our experts to think laterally, better formulate their research questions and build new hypotheses for further investigation.
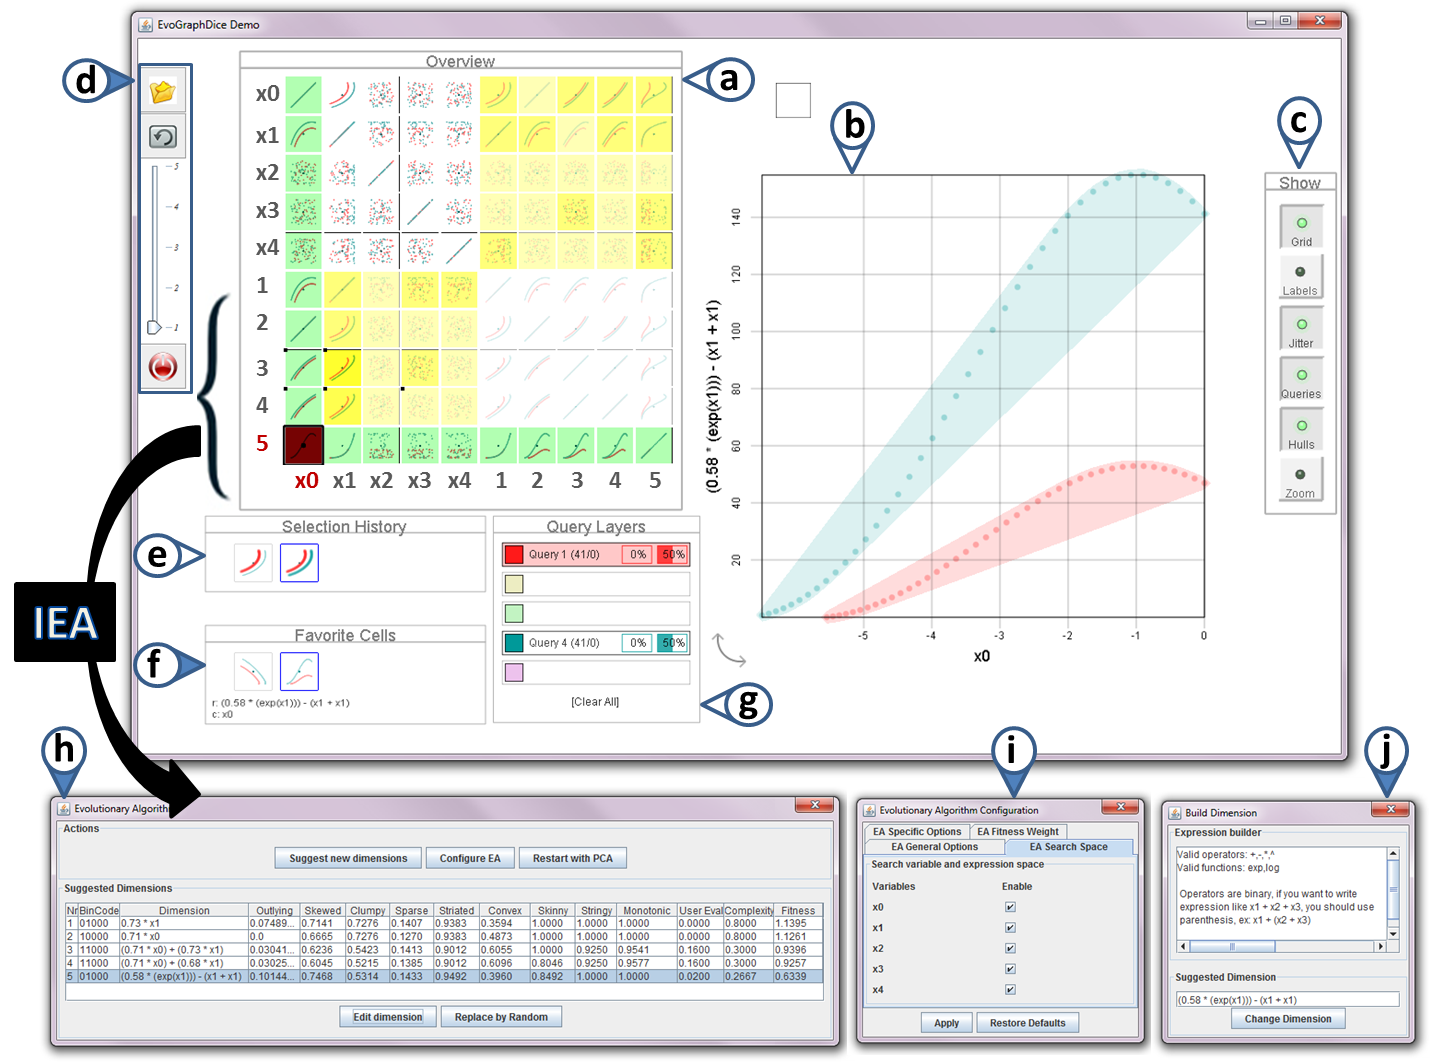
Figure 1: EvoGraphDice prototype showing an exploration session of a synthetic dataset. New extensions to the GraphDice system are indicated by coloured label arrows. Widgets: (a) an overview scatterplot matrix showing the original data set of 5 dimensions (x0..x4) and the new dimensions (1..5) as suggested by the evolutionary algorithm. (b) main plot view. (c) tool bar for main plot view. (d) a tool bar with (top to bottom)“favorite” toggle button, “evolve” button , a slider to evaluate cells and a restart (PCA) button. (e) the selection history tool. (f) the favorite cells window. (g) the selection query window. (h) IEA main control window. (i) window to limit the search space. (j) dimension editor.
Video and Demo
Please watch the demo video before running the application: video link
Try the demo (Java Web Start).
Requirements
- Java 6 or later.
- Infoviz Toolkit and the Java OpenGL Libraries.
Data Format
- The current version of EvoGraphDice accepts .CSV files with numerical values only (INTEGER, DOUBLE and FLOAT data types).
- Use the same format as in this example file: inputFile
Training Game Example
This example is designed to teach you how to operate EvoGraphDice.
- Data: select the "Curves Level 0" dataset from the file chooser dialog box button. This dataset contains two enclosed curvilinear dependencies between variables x0 and x1 and random data for the rest of the dimensions.
- Task: try to evolve a scatterplot where it is possible to separate the two curves (Fig.2, left) with a straight line.
- Guidelines:
- select cell (x0,x1) from the scatterplot matrix (in the white quarter).
- in the main plot view, make two lasso selections of the two curves (using two different colors)
- inspect the new cells in the yellow quarters of the matrix (i.e. hybrid cells), as this is where the solution will be.
- using the slider (from the tool bar on the left), give a rank to the cell from 1 to 5 (from least interesting to most interesting). This should correspond to how much overlap there is between the two lasso selections you made: the smaller the overlap the better the score. Try to evaluate at least two cells per row.
- when you are done with evaluating cells for this generation, press the evolve button to allow the algorithm to take your feedback into account.
- EvoGraphDice will suggest some new views and give an initial rating of each one. You may or may not agree with that rating, but in any case you should give your evaluation of a cell even if you agree with the system's evaluation (for re-enforcement). Note that user evaluated cells are flagged with a small black square (as opposed to system evaluated cells).
- if you find a view interesting, add it to your 'Favorite Cells' by selecting that view then clicking on the 'Favorite' toggle button. If a cell that you liked disappears from the matrix but it is in your 'Favorite Cells', double click on it to bring it back to the matrix.
- continue with this process of evaluation and evolution until you find a solution. There are many potential solutions to this game, two are shown below in Fig.2. You can try out these solutions using the EvoGraphdice 'Evolutionary Algorithm' widget -> edit dimension.
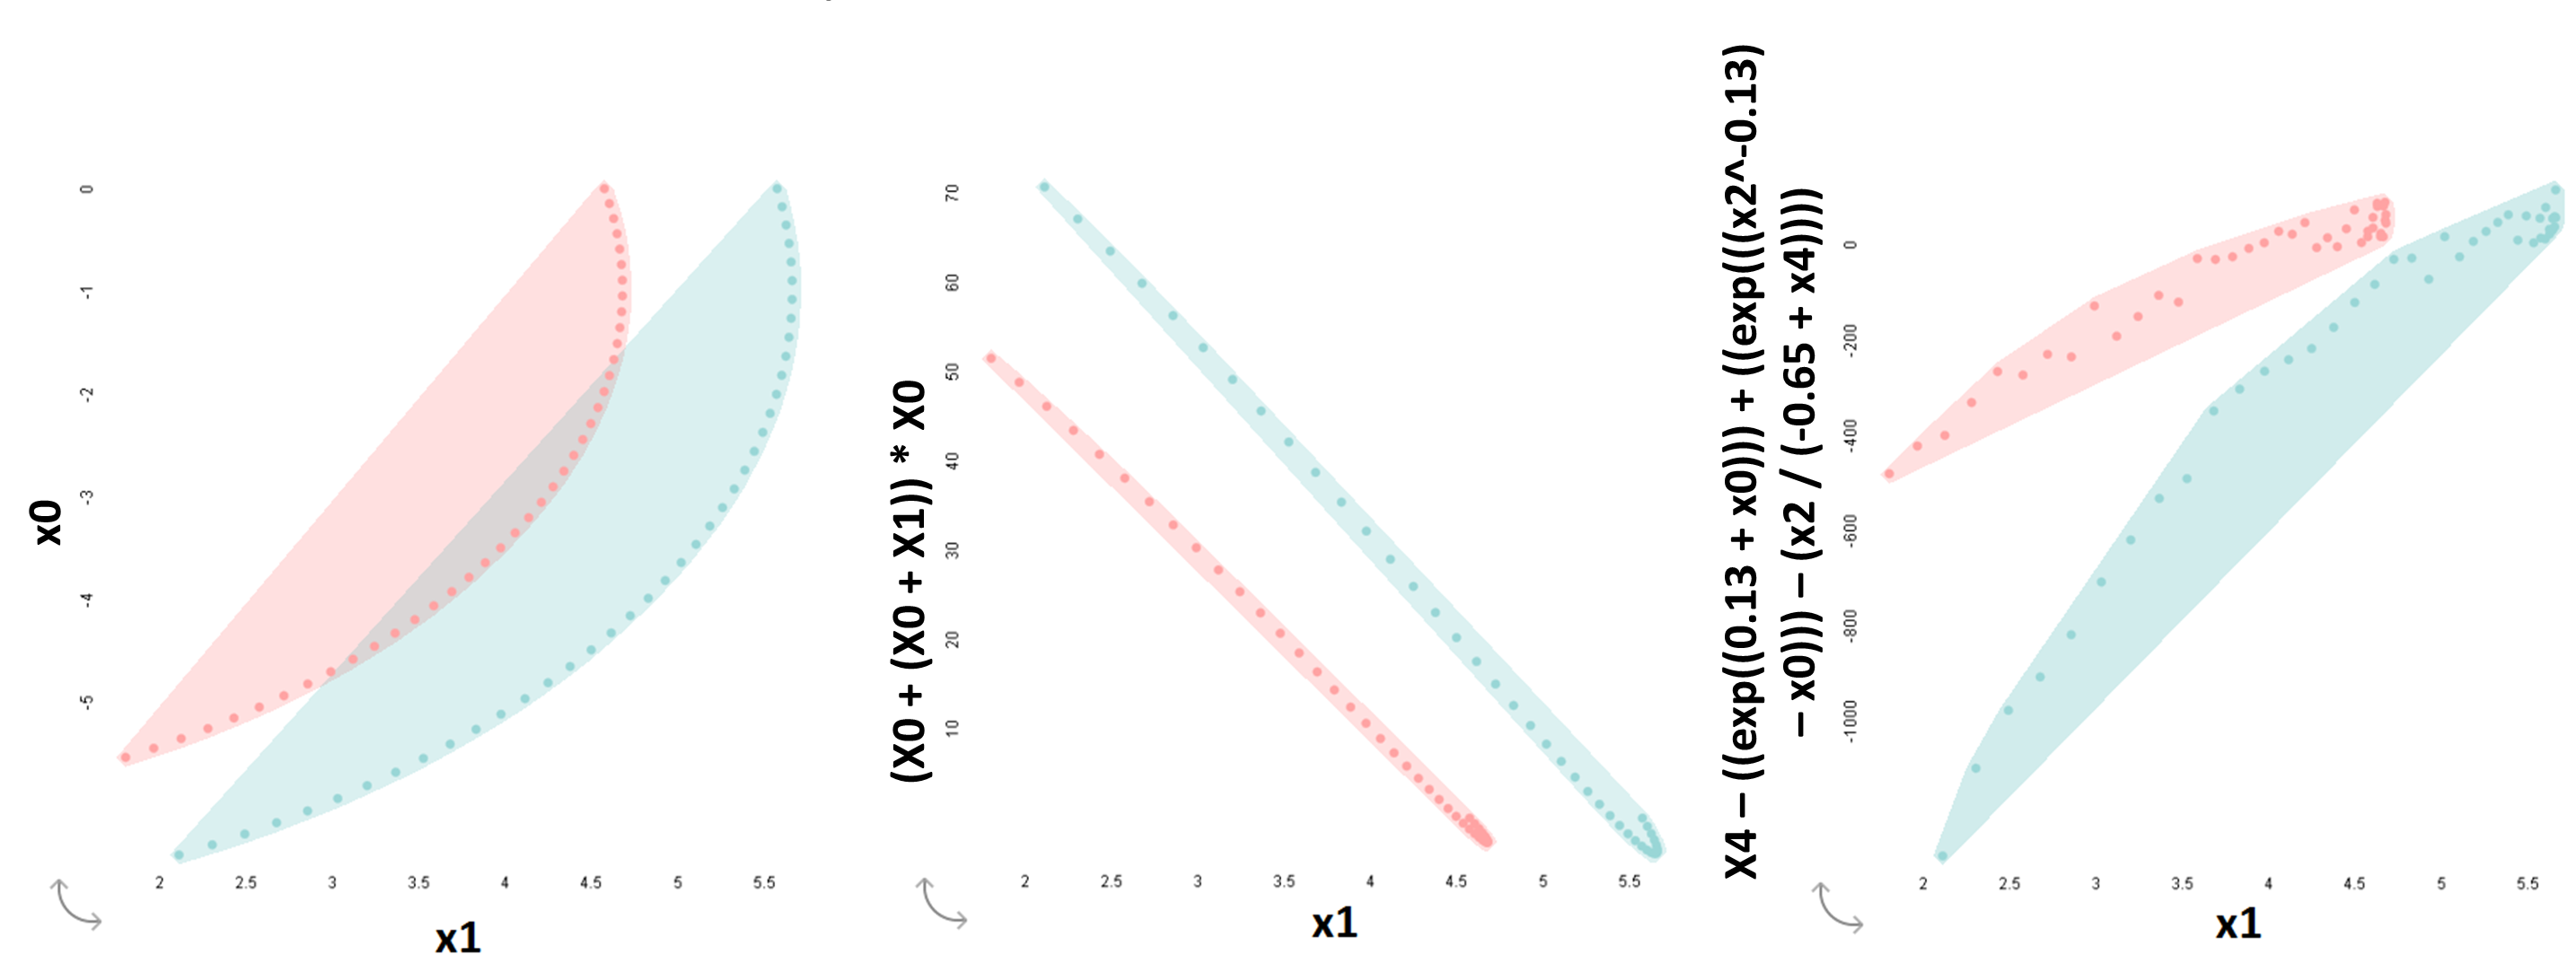
Figure 2: Two different solutions for the training game problem (left) that involve a simple dimension combination (middle) and a complex formula (right).