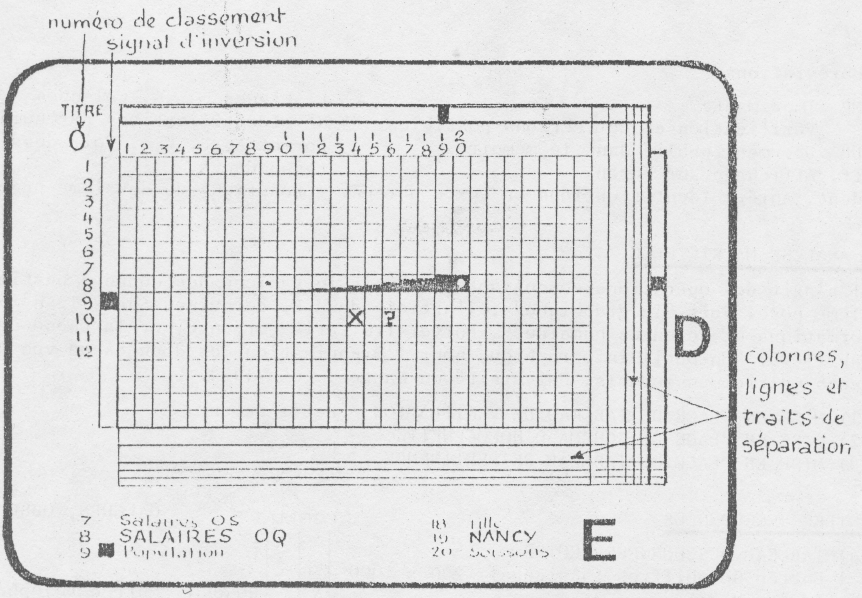
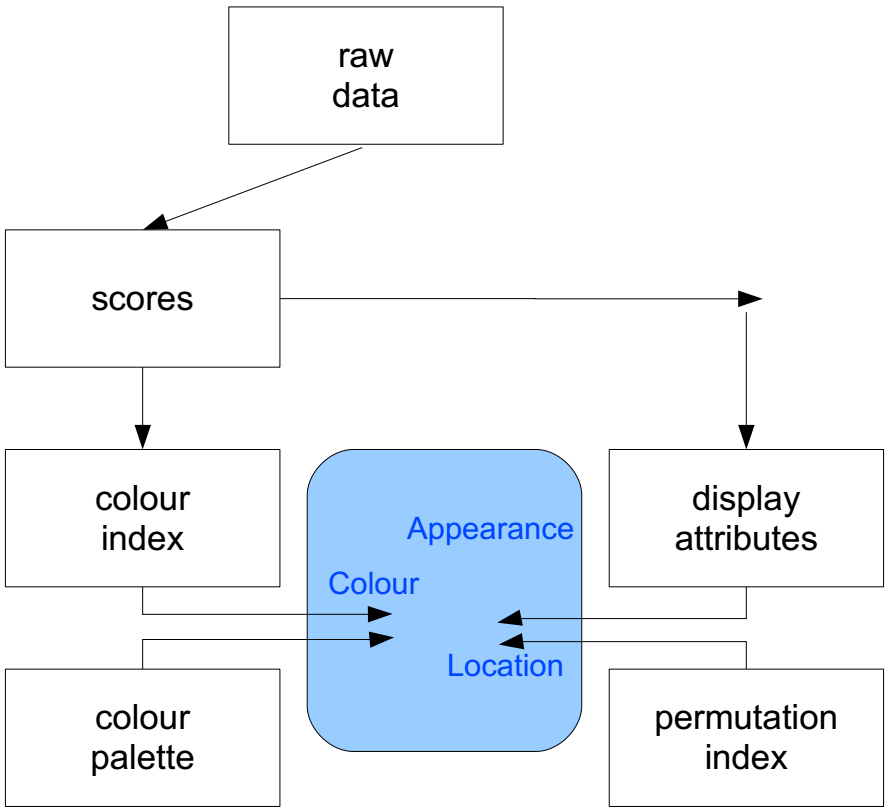
Annotated Bibliography
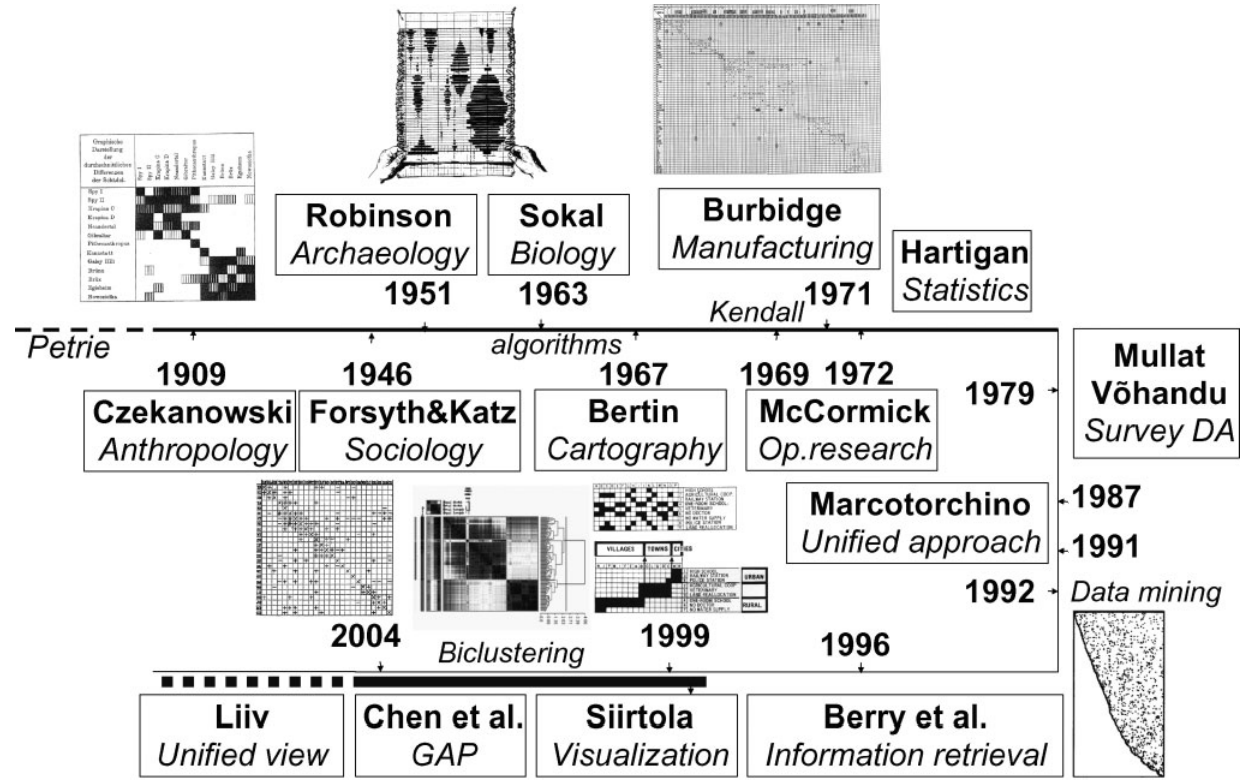
This page provides an annotated bibliography around Bertin's matrix method that extends the literature survey provided in our article. Here references are chronologically ordered and broken down into three categories:
Bertin's work and his legacy
In this section, we reference Bertin's work and works that came after him, based on his research.
Several articles were published in French and never translated.
1967 - F. Vergneault, R. Lamontagne, J. Bertin
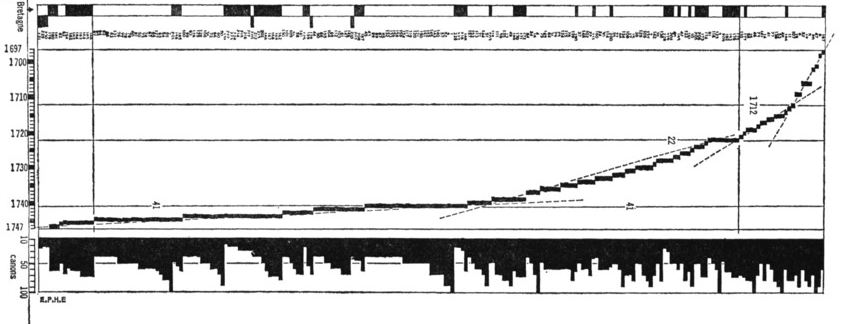
A case study that is a precursor of Bertin's ideas on graphic processing (le fichier image). Mentioned in (Bertin, 1969) and his book La Graphique et le traitement Graphique de l'Information, but described in more detail. It deals with heterogeneous data and presents the image using different sorting strategies. See the book L'oeil qui pense by Françoise Vergneault further down.
1969 - J. Bertin
Graphique et mathématique: généralisation du traitement graphique de l'information [French]
This article, published eight years before his book La Graphique et le traitement Graphique de l'Information summarizes Bertin's book and his method.
1976 - B. Kitous
Interactive Matrix Displays and Management Information Reporting: a Feasibility Assessment
Bernhard Kitous (see the entry below on his SIGGRAPH paper) was a student of Jacques Bertin before he started a PhD at Berkeley in 1972 on the use of matrix displays for business intelligence. He was kind enough to send us his PhD Dissertation titled Interactive Matrix Displays and Management Information Reporting: a Feasibility Assessment (June 1976). The dissertation is fascinating and really impressive work. The author can be reached at bernhard.kitous [at] ehess.fr.
1977 - J. Bertin
La graphique et le traitement graphique de l’information [French], english version: Graphics and Graphic Information Processing, (1981)
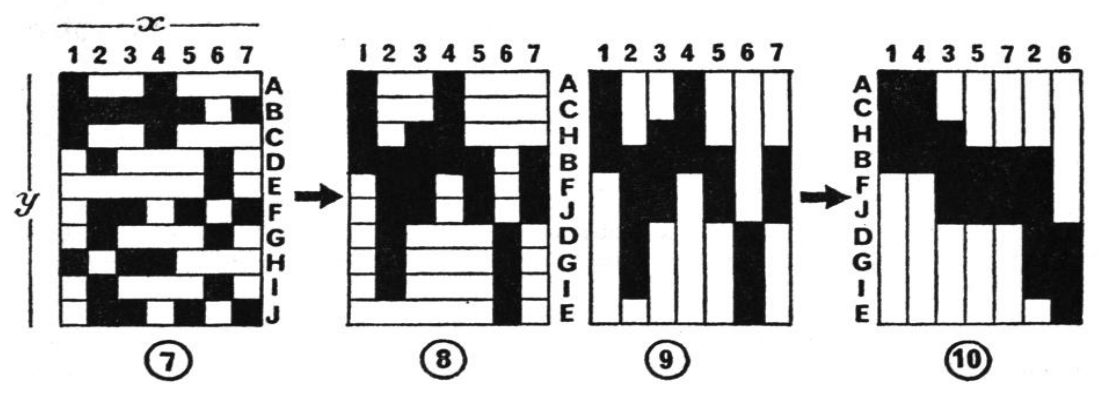
In this book, Bertin describes his step-wise method for creating visualizations from data tables. He describes the Matrix and other methods such as the family of curves and the maps. Bertifier is mainly inspired from this book. Although it is much less famous than Semiology of Graphics, we believe every Infovis researcher should have a look at it.
Some citations from the book (in French), that we will try best to translate:
- A graphic is not ``drawn once and for all; it is ``constructed and reconstructed until it reveals all the relationships constituted by the interplay of the data.
- A graphic is never an end in itself; it is a moment in the process of decision-making.
- The best graphic operations are those carried out by the decision-maker itself.
- [Graphics] is a strict and simple system of signs, which anyone can learn to use and which leads to better understanding.
- [Manipulation] is fundamental. It is the internal mobility of the image that characterize the modern graphic.
- The useful information corresponds to the appropriate reduction of Entries length in the data table. It is not the groups which allowed to construct the table, but new groups defined by the relations that the data have.
- [We visually interpret missing data by] reconstruction by neighborhood and matricial interpolation
1977 - W. Benson, B. Kitous
Interactive analysis and display of tabular data

This forgotten SIGGRAPH article describes a complete system with almost all features Bertin described for Matrices: data selection and calibration, binning, data scaling, choice of graphic variable, scaling of the graphic variable, rows and columns permutation and grouping. It was published the same year as bertin's book La Graphique et le traitement Graphique de l'Information.
1982 - J. Bertin
Cahiers des charges pour un mini-ordinateur graphique [French]
Bertin describes in this article the requirements for implementing the Matrices. Although it was written at a time when computer possibilities were low, most of his requirements are still valid today.
We had difficulties recovering this forgotten publication. We thank Michel Bussi, who forwarded our request to François Gay, who forwarded to Philippe Lecarpentier, who scanned the paper we provide.
1984 - J. Le Fourn, A. Mailles
Un micro ordinateur graphique: Programmes réalisés et exemples d'application [French]
[TODO]
1984 - G. Caraux
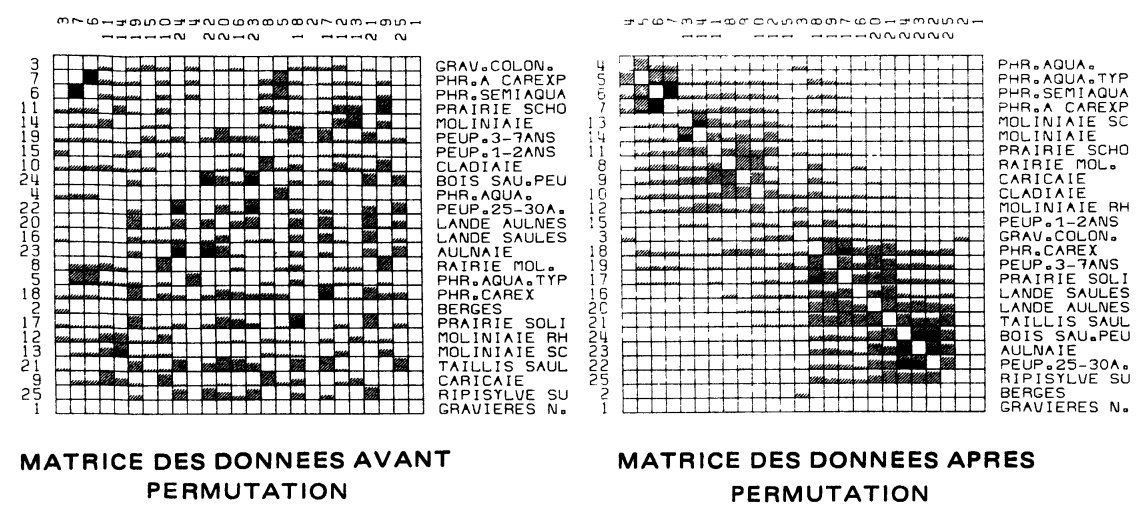
This articles compares reordering algorithms. It uses an example from Bertin as a case study. Figures are generated from a computer and faithful to Bertin's graphical style.
1987 - M.-F. Durand, R. Gimeno
de TMX a CARTAX ou d'un logiciel de recherche à un logiciel d'enseignement [French]

This article discusses the software TMC, Matrix, Crecart and Cartax, developped at EHESS (Ecole des Hautes Etudes en Sciences Sociales), Bertin' s laboratory. TMC ran on Apple II 64k and the others on Thomson TO7 and MO5 (see our review of systems for more detail). They were all used in French schools as tools for Cartography in the 80's.
1988 - Y. Girault, T. Rukingama
Évaluation de l'exploitation d'une visite au zoo par le traitement graphique [French]
This paper presents the results of using the MATRIX software (see our review of systems for more detail) for pedagogical purposes in an elementary class. The pupil's task was to collect data during a zoo visit and analyze the results in class. They used the Matrix software for exploring the data they collected. They found that this process had a positive aspect for the pupils, as it has a playful factor. However, the main issue they had was the learning curve of the software and the "magic" behind the automatic reordering algorithm. They recommend to first use traditional tools (e.g., scissors, paper and pen), them manually build the matrix using the software, and only at the very end, use the automatic reordering. As they say,
(We have to be very careful, because the children do not have a critical mind about the data inputed in the computer.)
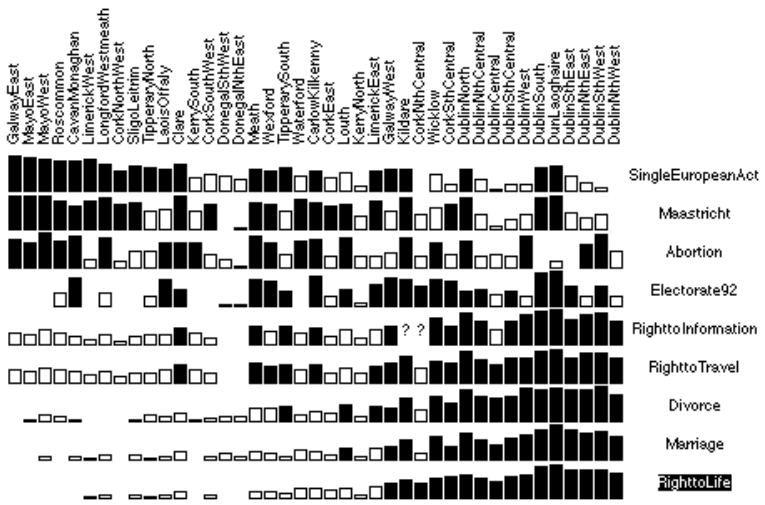
1994 - J. Bertin, J. Risson, J.H. Chauchat
Logiciel AMADO - Analyse Graphique d'une MAtrice de DOnnées [French] (see our review of systems for more detail)
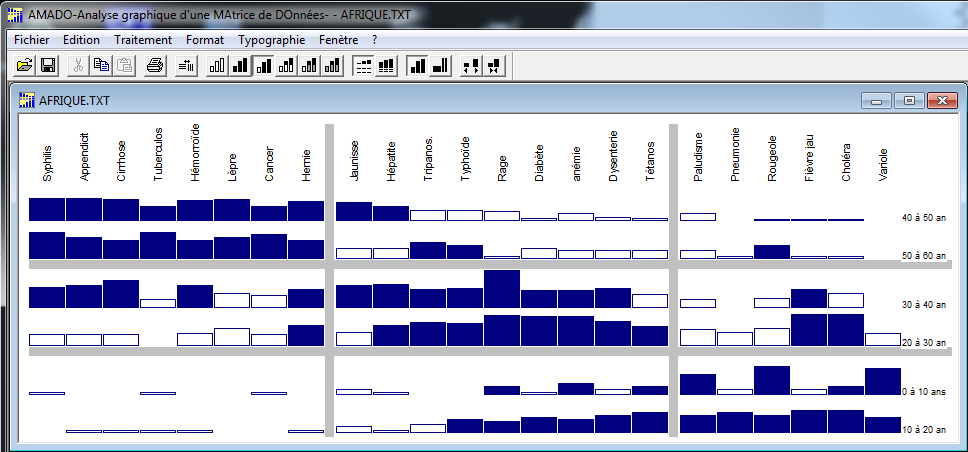
[TODO]
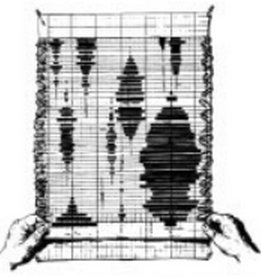
1996 - A. de Falguerolles, F. Friedrich, G. Sawitzki
A Tribute to J. Bertin’s Graphical Data Analysis
The images in the article were produced using the software Voyager (see our review of systems for more detail)
1996 - G. Sawitzki
Extensible statistical software: On a voyage to oberon
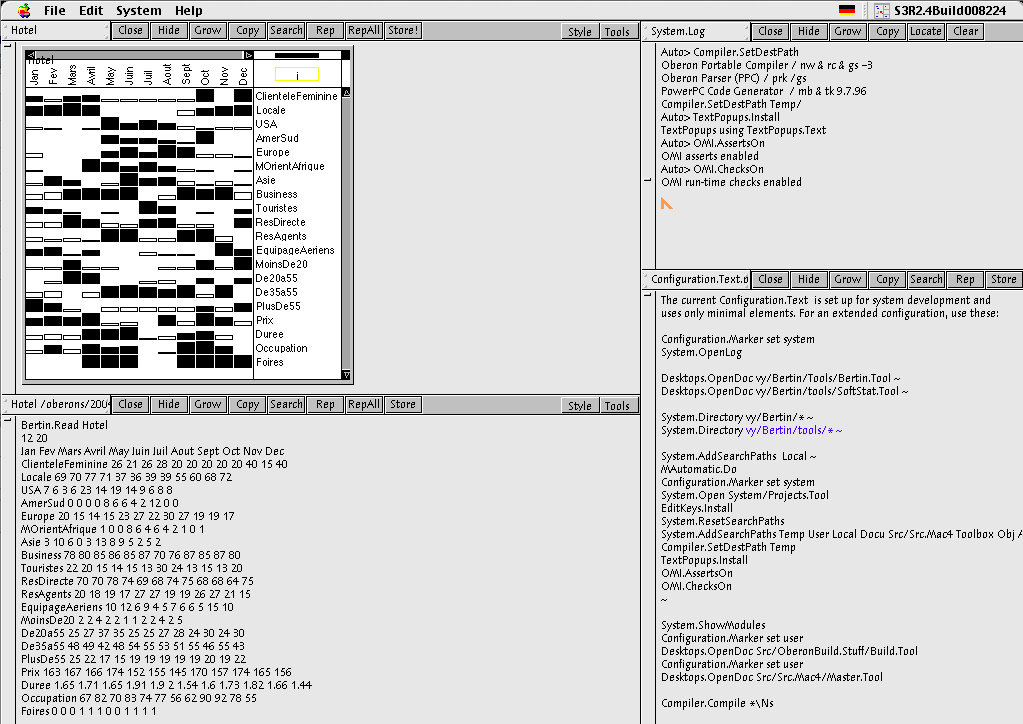
Implementation of Bertin's matrices in the Voyager system.
More information about this project is available on the author's webpage. We are grateful to the authors, who created a new page and created several videos very quickly after we ask them information about their implementation. see our review of systems for more detail about the Voyager software.
1998 - S. Bonin
Le développement de la graphique de 1967 à 1997 [French]
[TODO]
1998 - F. Vergneault-Belmont
L'oeil qui pense: Méthodes graphiques pour la recherche en sciences de l'homme [French]
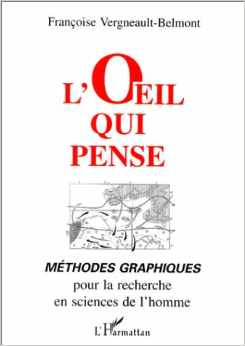
Françoise Vergneault-Belmont co-authored with Jacques Bertin the first article making use of mobile images: Traitement graphique d'une information : les marines royales de France et de Grande-Bretagne (1697-1747) (see above).
This book is hard to find. We were able to borrow a copy but can't provide a PDF online. The book makes almost no reference to Jacques Bertin. The author gives a long introduction stating the importance of working with the researchers who provide the data (something Bertin advocated too), but only mentions Bertin once, to point out her influence on his book La Sémiologie Graphique.
How much Vergneault-Belmont contributed to Bertin's work remains a mystery. We were told by archivists that the two did not get along. She hated computers, while Bertin was fascinated by their possibilities. Their writing styles are quite different.
1998 - M. Green
Toward a Perceptual Science of Multidimensional Data Visualization: Bertin and Beyond
[TODO]
1999 - H. Siirtola
Interaction with the reorderable matrix
see our review of systems.
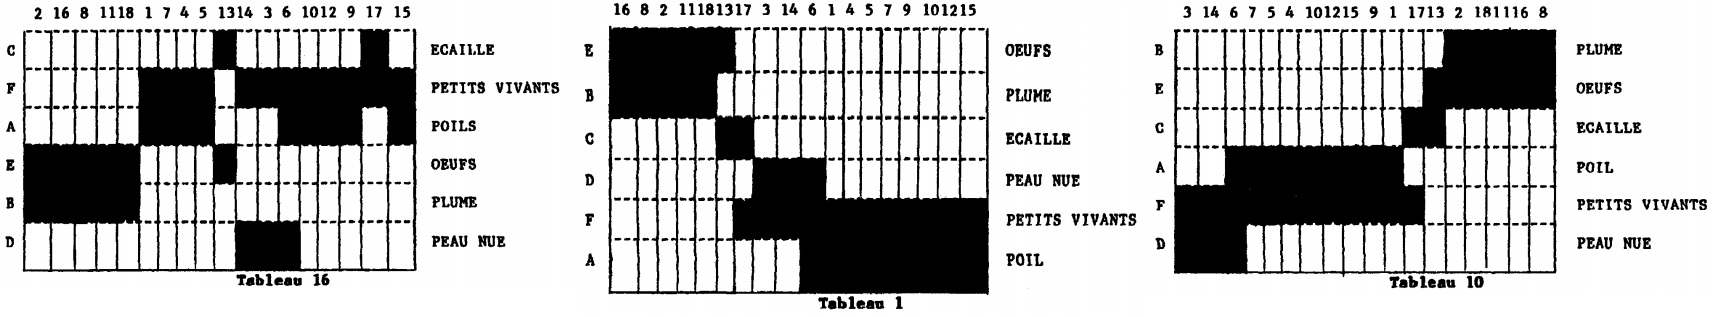
Siirtola published several articles on Bertin's matrices, that he called Reorderable Matrix. This first article is a study evaluating the usability of the interactive reorderable matrix for persons who had no prior experience with it. The only available interaction was the ability to drag a cell to move its row and column to a new position, and reset the matrix.
He found that the simple ability to reorder the rows and columns of a matrix improves both the execution time and the accuracy, and that people learn no use it in a few minutes and concludes by saying that the reorderable matrix would be a nice feature for spreadsheet programs.
However, his experiment highlighted several limitations of his system: he found that his implementation lacked affordances. Users also need a feedback during the row and column movements (e.g., highlighting the current selection), and dragging a cell should impact only one direction, i.e. moving only horizontally or vertically, but not both at the same time. Users also want to be able to group rows or columns and move them all at once, and to be able to visually separate these groups.
2001 - J. bertin

Bertin's last iteration on his theory.
2003 - H. Siirtola
Combining parallel coordinates with the reorderable matrix
Siirtola combines the reorderable matrix with parallel coordinates and adds to his specification of an implementation of the reorderable matrix: Moving a row or column to a new position; sorting according to a row or column; transposing the matrix.
2003 - P. Orús, G. Villaroya
TGINF: graphic information processing for teaching
[TODO]
2003 - G. Palsky
L'esprit des cartes - Chap 2 Autour de Jacques Bertin [French]
Describes the origins of Mobile Image idea of Bertin. Also describes precursors to Bertin Matrices (p.99):
2004 - H. Siirtola
[TODO]
2004 - J. Bertin
Aux origines de la sémiologie graphique [French]
One of the last articles from Bertin.
2005 - H. Siirtola, E. Mäkinen
Constructing and reconstructing the reorderable matrix
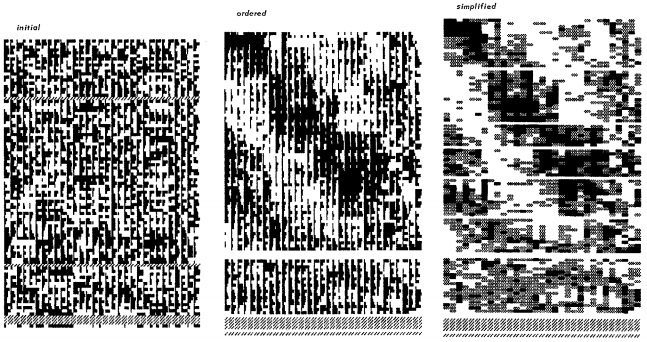
The authors note that even statisticians admit that the visualization methods are often far more effective than many of the proposed clustering methods that usually give conflicting answers and expose to the danger of over-interpretation. They briefly discuss why fully automatic clustering is not always appropriate.
They presents a simple but faithful computer implementation of Bertin's reorderable matrix and briefly discusses its design. They Report on user studies showing that for cluster identification tasks, support for matrix reordering is important, and that automation allows to be way faster and more accurate. They proposes a semi-automatic reordering interface involving a column proximity matrix and shows that people understand it. They also find that people expect algorithms to be deterministic (consistent results) and stable (small actions produce small effects).
The available operations were: moving a row or a column to a new position by dragging a cell, sorting the matrix according to one row or column by clicking at the beginning or end of the row/col, the ability to reorder automatically the matrix by clicking a button, and The user can also interactively set a threshold impacting the scale. More precisely, it was the maximum limit of the values range, then all values above this threshold were attributed the maximum value. User tests validate the usefulness of mixing automatic and manual reordering.
They show that adding automatic algorithms reduce the time spent and accuracy by about 24%, and by about 60%at the cost of adding a dual view representing correlation coefficients, which is not an easy concept for everyone. Their participants were undergraduate and graduate students, used to computers and with mathematical background.
They also point out that the reorderable matrix is easy to learn, that being able to lock rows or columns would help reducing complexity, and that users want to be able to reorder only a subset of the matrix.
2010 - I. Liiv
Seriation and Matrix Reordering Methods: An Historical Overview
[TODO]
2010 - M. Garcia, W. Huang, C. Seifert, W. Wallisch
Literature Survey: The Reorderable Matrix
[TODO]
2010 - G. Sawitzki
Bertin's matrices - an R implementation
An implementation of Bertin's matrices in R, as a subset of 1996 - Sawitzki (see above).
see our review of systems.
2011 - J.P. Bord
Jacques Bertin et les géographes. Point de vue d'un géographe-cartographe [French]
Complains that the sémiologie graphique did not catch on, and even more so the graphic information processing. Lists matrix processing software that has been developed: TMC (Traitement Matriciel et Cartographique); Mac-map ; Amado (see our review of systems for more details about these software).
Before Bertin
In this section, we cover earlier work that might have inspired Bertin or that is related to his work.
384 BC-322 BC - Aristote
[TODO]
1873 - T. Loua
Atlas Statistique de la Population de Paris [French]
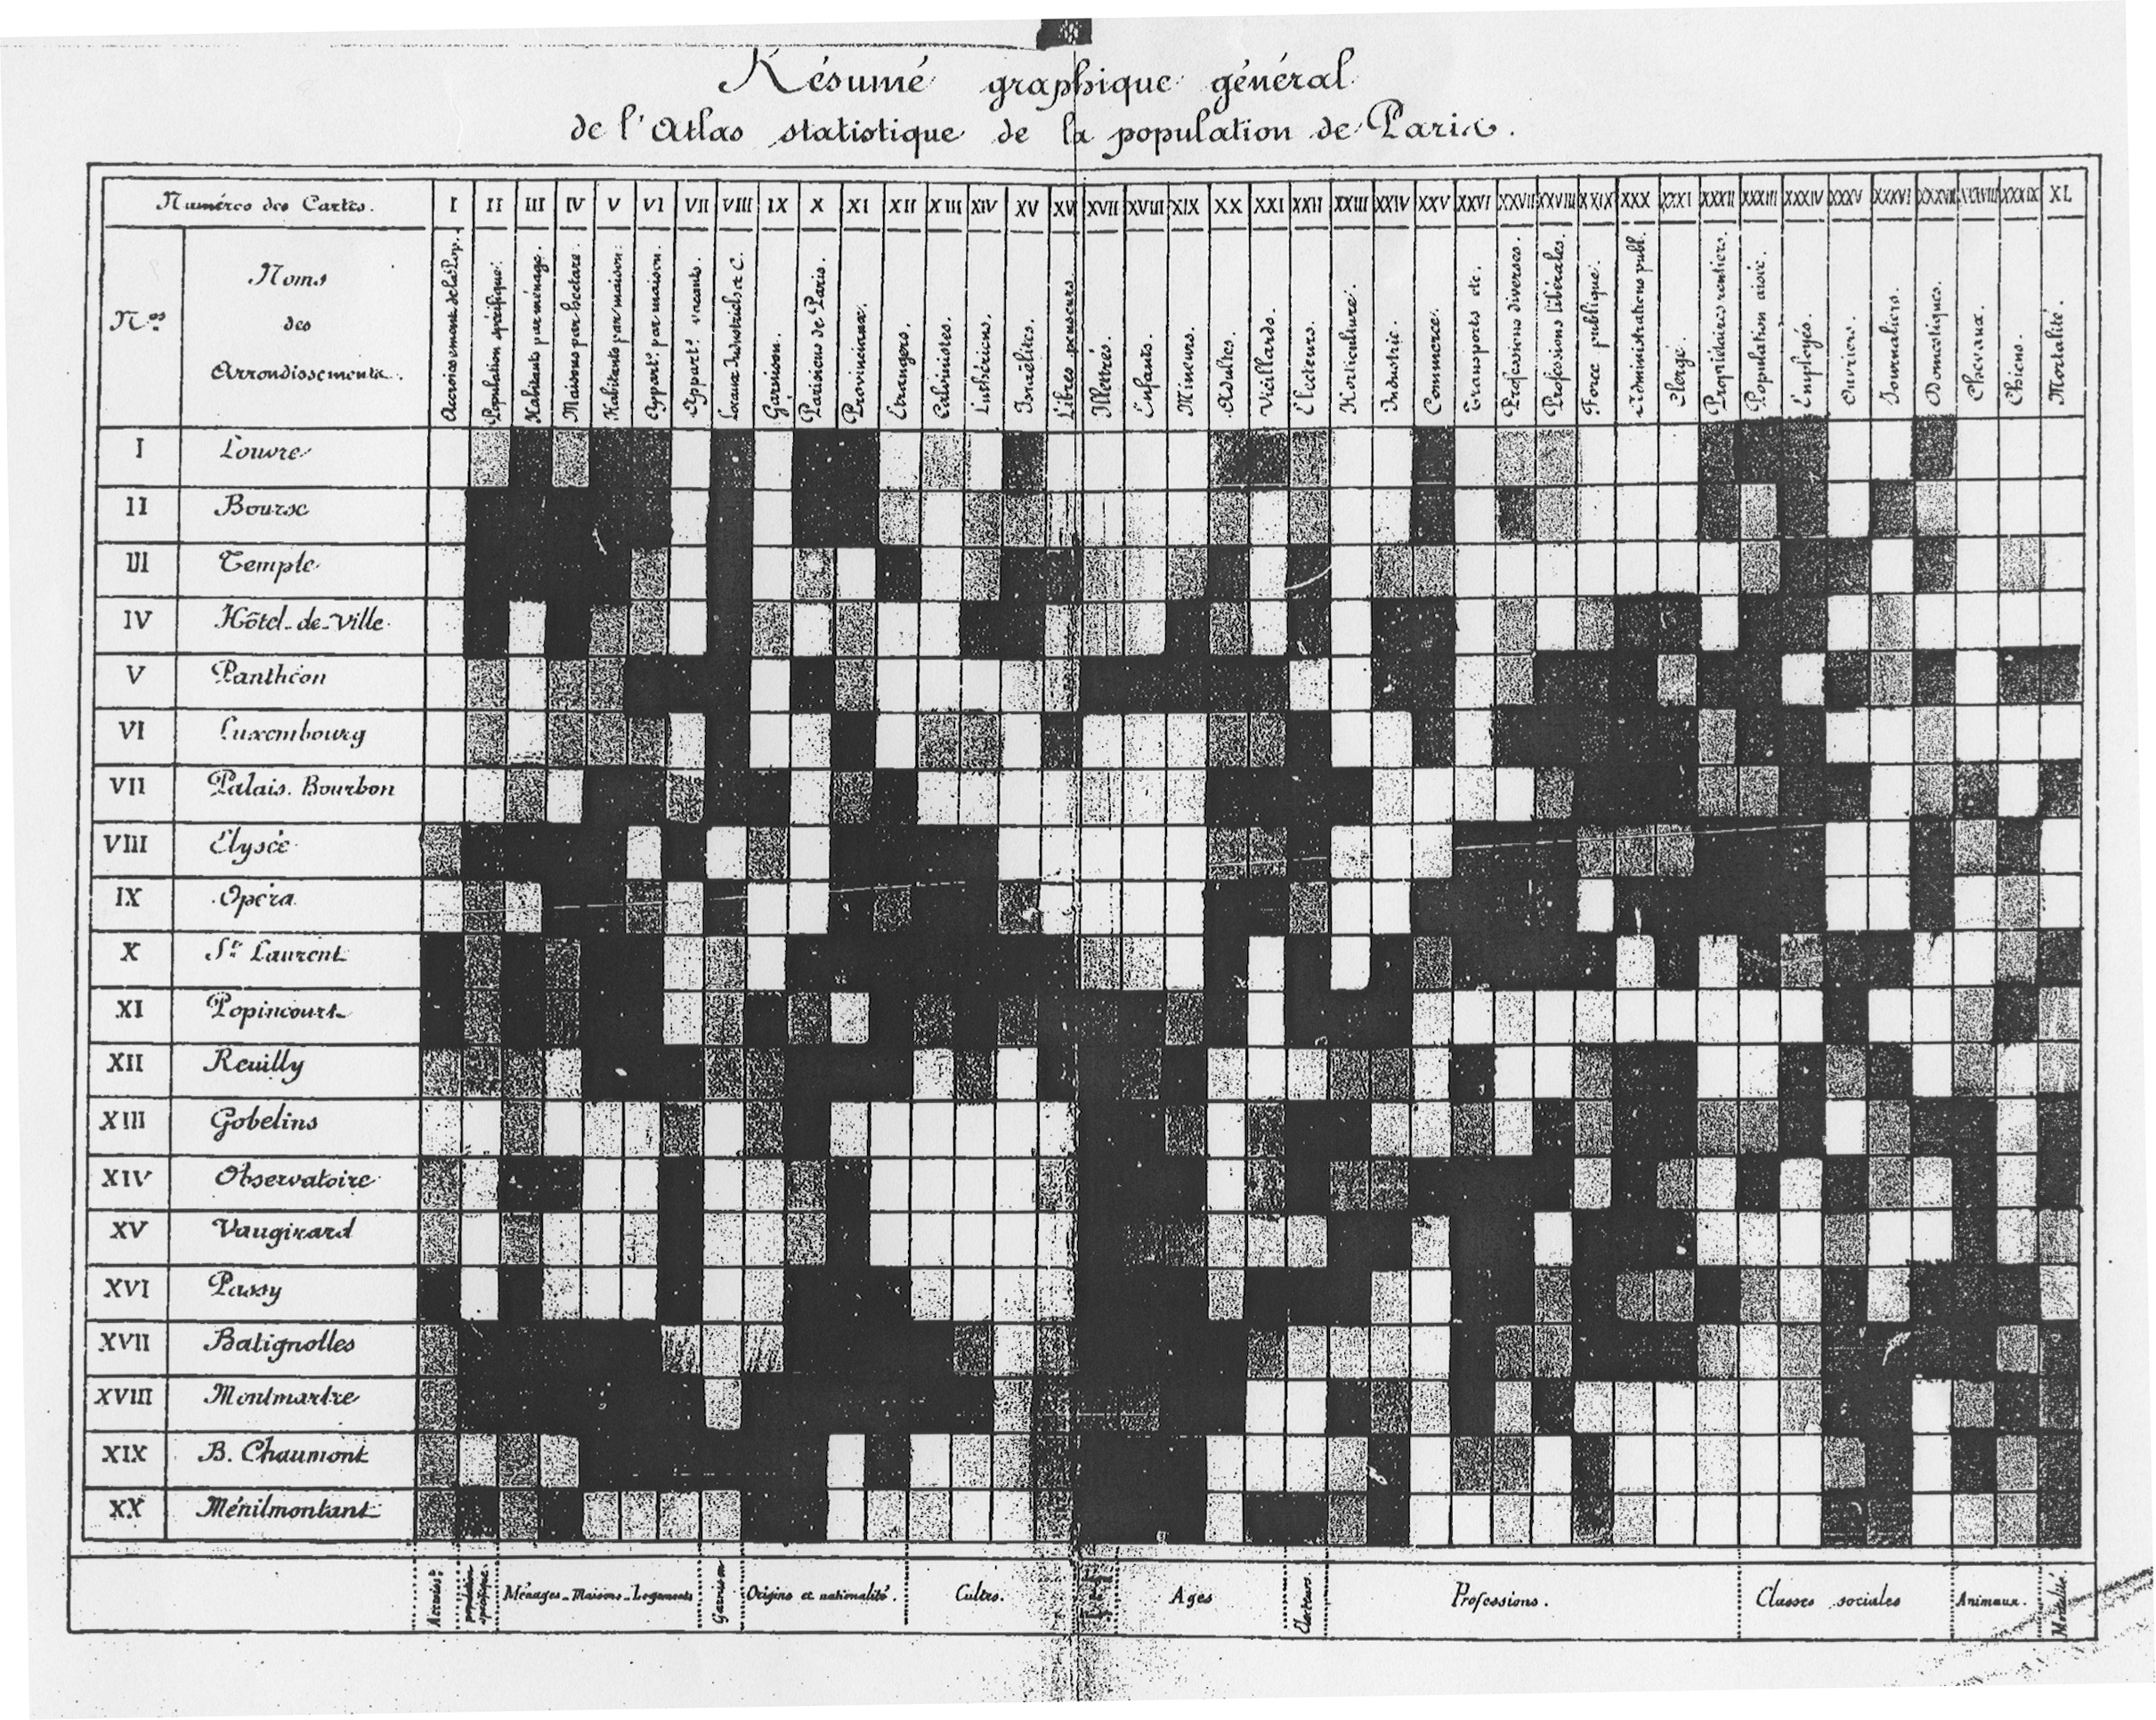
[TODO]
1899 - W.M. Flinders Petrie
Sequences in Prehistoric Remains
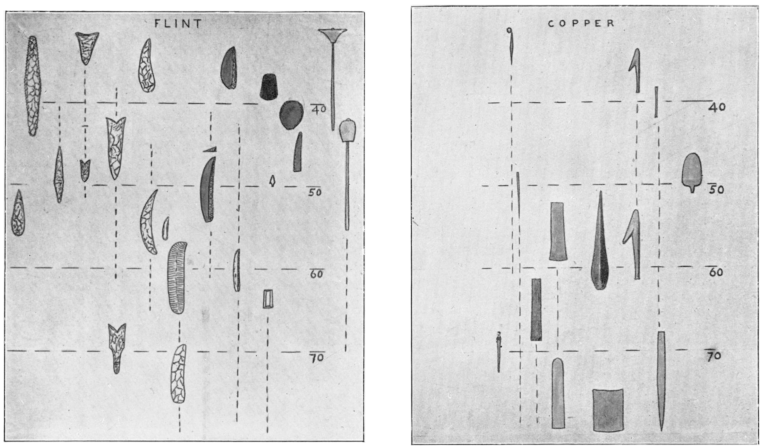
English Egyptologist Flinders Petrie reordered strips of paper to reconstruct the chronology of excavated graves. He Introduces the first seriation method using reorderable cards and slips. Reordering is 1-D.
1909 - J. Czekanowski
Zur Differentialdiagnose der Neandertalgruppe
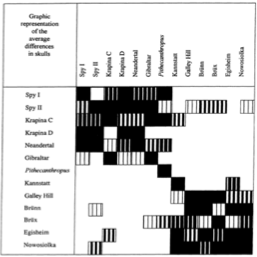
He encodes the cell values using 5 different black and white patterns.
1914 - W.C. Brinton
Graphic Methods for Presenting Facts
[TODO]
1939 - W.C. Brinton
In this book, Brinton makes a review of graphic presentations. He references many tabular visualizations (in particular, pp. 33-57).
1946 - E. Forsyth, L. Katz
A matrix approach to the analysis of sociometric data: preliminary report?
[TODO]
1950 - E.A. Suchman
The scalogram board technique for scale analysis?
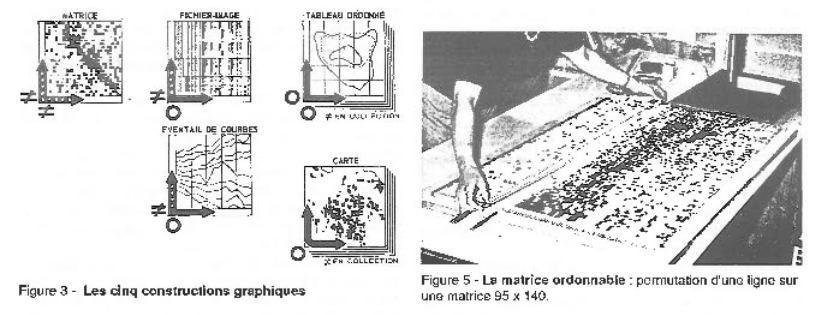
Early permutable matrix. In the 1950s, the Israeli mathematician and psychologist Louis Guttman built one called the ``scalogram board''
for analyzing questionnaire responses.
We did not manage to get this paper, but it is mentioned in 1953 - Gibson, 1956 - Green, and 1957 - Pagès.
1951 - W.S. Robinson
A method for chronologically ordering archaeological deposits?
Archeology
[TODO]
YYYY - W.A. Gibson
A simple procedure for rearranging matrices
Gives a good description of the scalogram board: the device consisted in two separate wooden boards, one for reordering rows and the other one for columns, and data items were represented by ball bearings that could be transferred between the two boards.
Gibson criticizes the scalogram as impractical.
1956 - B.F. Green
A method of scalogram analysis using summary statistics
[TODO]
1957 - M. Pagès-Anselme, A. Lévy-Schoen
Brevet d'invention pour scalogramme à panneau simple [French]?
French sociologist Robert Pagès built a magnetic version of the scalogram called ``le permutateur''.
1959 - M. Pagès-Anselme, A. Lévy-Schoen
Permutateur à deux directions, lignes et colonnes, pour la recherche d'échelles hiérarchiques ou de structures analogues [French]?
[TODO]
1966 - B.F. Green
The computer revolution in psychometrics
[TODO]
1968 - R. Bachi
Graphical Rational Patterns: A New Approach to Graphical Presentation of Statistics
[TODO]
2008 - L. Wilkinson, M. Friendly
The History of the Cluster Heat Map
[TODO]
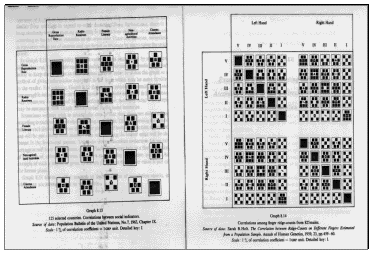
2008 - E. Robson
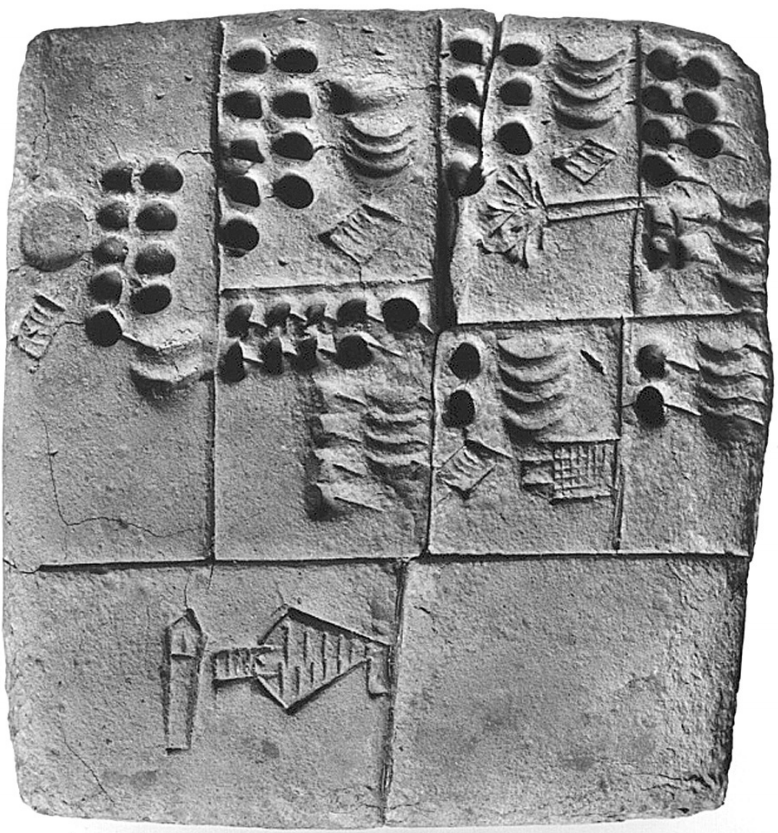
Tables and tabular formatting in Sumer, Babylonia, and Assyria, 2500 bce–50 ce
[TODO]
2011 - F.T. Marchese
Exploring the Origins of Tables for Information Visualization
[TODO]
2012 - T.L. Gertzen, M. Grötschel
[TODO]
Template
YYYY - Authors
[TODO]
Misc
In this section we provide links to online blogs, videos, etc. that are related to Bertin.
Video - Bertin talks about his Painter's eye
Flash application
Blog post - by E. Bertini - The hidden legacy of Bertin and ``The Semiology of Graphics''
Blog post - by E. Bertini - Video Interview: JD Fekete talks about Jacques Bertin
Video podcast on Data Stories, by E. Bertini and M. Stefaner - Episode #17: Data Sculptures, with Y. jansen and P. Dragicevic
link
Several sequences show Bertin's matrices and physical manipulation of data.
License
 | All material on this page is CC-BY-SA. If you reuse or adapt it please reference our article and/or link to www.aviz.fr/bertifier. |