Introduction to P5
For the remainder of the course we will be creating our own visualizations and learn how to implement specific types of visualizations. To do so we will be using P5 - a javascript interpretation of processing. Why? Because P5 gives us a lot of freedom for creative design while offering a low entry barrier for those of you who don't have a strong coding background. P5 has been designed to make coding accessible for artists, designers, educators, and beginners.
Today we will be setting up P5 and doing a simple exercise.
Download the slides for the tutorial here
Lets get started - Setup
Download the beta version of the P5 editor: https://p5js.org/download/#editor
or set up P5 with an editor of your choice: https://p5js.org/get-started/ (under "Environment")
In class I am going to use the P5 editor.
Learn P5
The most important reference for you throughout the remainder of the course will be the reference https://p5js.org/reference/, the tutorials http://p5js.org/tutorials/ and the examples https://p5js.org/examples/
In-class exercise
Create a Website that loads your tutorial sketch (the P5 editor will do this for you automatically). The tutorial sketch should be loading the Vispubdata-Grobid-min.csv file. By the end of the tutorial you should be able to display a line for each paper in the data file and modify some properties of this line.
Assignment
Based on the research question you chose for the last assignment, choose one entity in your dataset that is important to you. This could for example be the authors, papers, keywords, years, etc.
For each of - or an aggregation of these entities do the following:
- choose a visual mark to display the data items.
- choose a minimum of two visual variables - other than color hue - to display at minimum two different pieces of information for each data item (e.g. in your tutorial example above this could be the year of each paper and the number of authors - or many other things).
- load a data file that contains the data you need to display - if you don't have a data file that contains your information, create it using R or OpenRefine
- implement a P5 sketch that draws your data items and their two values (again, do not use color hue - we will start using color after the perception lecture)
- create - or have the P5 editor create - a .html file that I can open to run your sketch. On this website add additional text to tell me what data items you encoded and which mark and visual variables you used to encode which information. On this website also site sources if you copied code from external sites or examples (this is fine to do - as long as the sources are acknowledged).
Look up the lecture slides for this week's introduction to visualization if you do not understand the terms visual mark and visual variable.
Submitting the Assignment
WHAT - You should submit a single ZIP file called "YOUR_LASTNAME-Assignment5.zip" via email. It should contain:
- Your sketch and the website as described above.
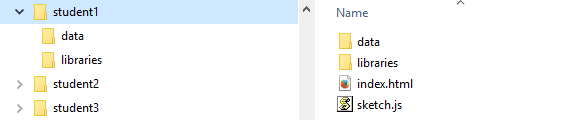
- Your .zip file should contain no directories apart from the ones that are part of your sketch. As in this screenshot (note that I extracted the zip file with a script into the "student 1" folder):
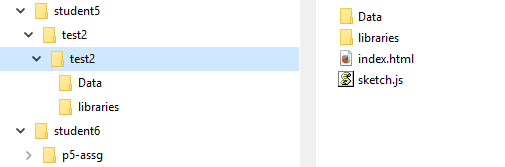
and NOT like in this screenshot:
Make sure that your code runs. I will be using Firefox or Chrome to look at the visual result of your exercise.
WHERE - You should email the file to petra.isenberg@inria.fr with the subject VA-Assignment5.
WHEN - Assignment 5 is due before "23:00 on Wednesday, November 9th.'''