Choosing a Research Questions & First Analysis
Choose a Research Question
In the remainder of the course we are going to continue using the dataset we have already begun to explore in class. The dataset of IEEE VIS publications is part of ongoing research and has just been made available to the world. You will be one of the first to dig into and explore this dataset, so there are still lots of interesting observations to make and tools to build.
The full dataset, and explanation about its variables, as well as some first simple visualizations can be found at the following url: http://www.vispubdata.org
In class we have already begun to discuss some interesting questions we may want to ask about this dataset - or tasks we may want to use the dataset for.
Your task is to now choose one of the tasks or higher-level questions that you are interested in and to prepare your first exploratory analysis into the data, keeping this question/task in mind. In the following I prepared a few sample tasks and questions that you can choose from. If you would like to ask/choose other questions, please contact your instructor to verify that you question is at the adequate level for this and the following assignments.
NOTE: in the following descriptions I talk only about papers of type "J" or "C" in the dataset. It is best to also restrict your analysis to these two types of paper.
Sample Research Questions
Supporting Peer-Review
Every paper in the dataset (of type "J" and "C") has undergone a process called peer-review (read the following wikipedia article for more details). This means that in order to get accepted at the IEEE VIS conference, the paper has been assigned to four reviewers all of which read the paper, gave comments, and gave it an accept or reject recommendation. The process of peer-review, however, is not without problems (see this Nature article or this JRSM paper). One of the challenges with peer-review is finding the right experts for a paper with a given topic. These experts have to have two main properties:
- they need to be (very) knowledgeable about the topic of the paper. Knowledge about a topic, can, for example be established by looking at the past work of a reviewer -- their past papers and the topics of these papers. A knowledgeable reviewer is also typically one who has been active in the community by publishing papers for a few years (although it does sometimes happen that a PhD student with only 1-2 published papers can become a reviewer if they are sufficiently specialized).
- they are not allowed to be in conflict with any of the authors of the paper. A conflict arises if a reviewer has co-authored a publications (with any of the authors of the paper subjected to peer review) within the last five years (there are also other sources of conflict such as joint grants, friendships, or supervisor-student relationships - that we will not consider here).
Here a picture of what a typical reviewer assignment page looks like. Can we do something graphical that is better?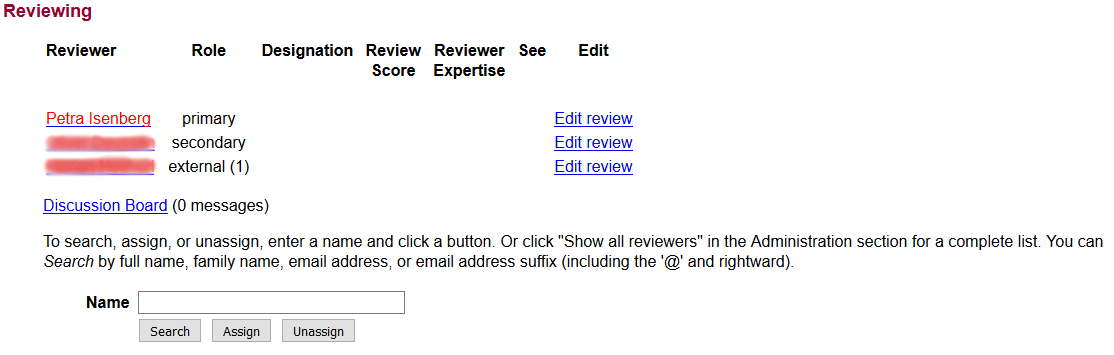
One potential research questions on the peer-review topic is, thus:
- Who would be a good reviewer for a given paper?
Understanding Individual Researchers
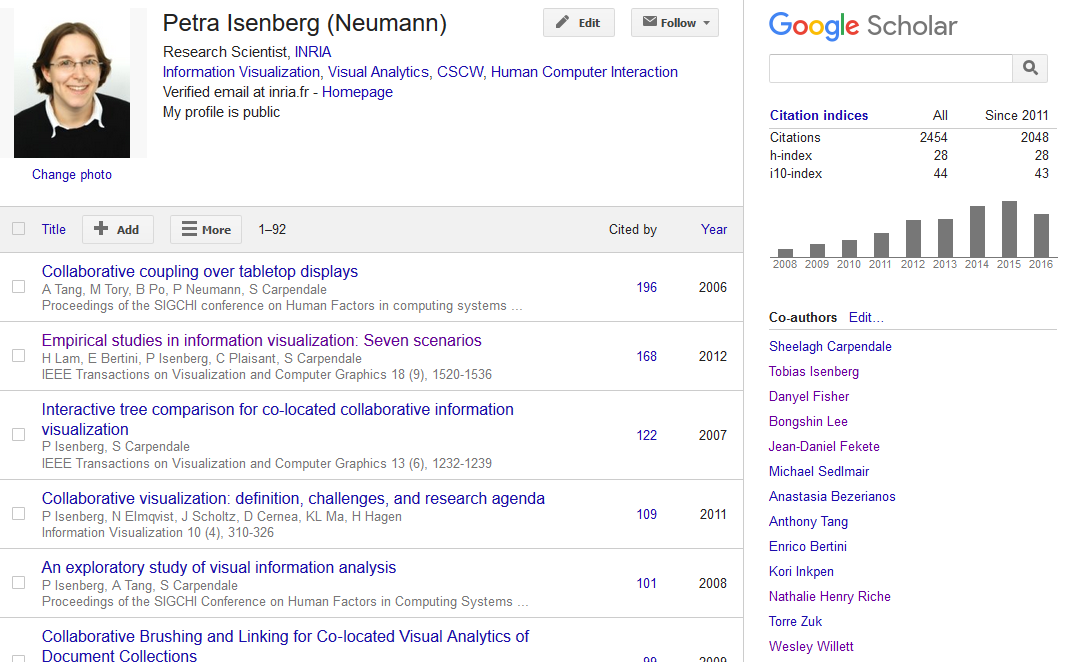
The community of visualization is extremely divers with people working on many different topics over a number of years. Given the publications of a specific researcher there are a number of interesting things we can learn about them: their history, their (changing)interests, their social network, their expertise, etc.
This is what google scholar displays for a researcher's profile. Can we provide better overviews?
One potential research question this topic is, thus:
- What does a researcher's research track and environment look like?
Understanding the Field of Visualization
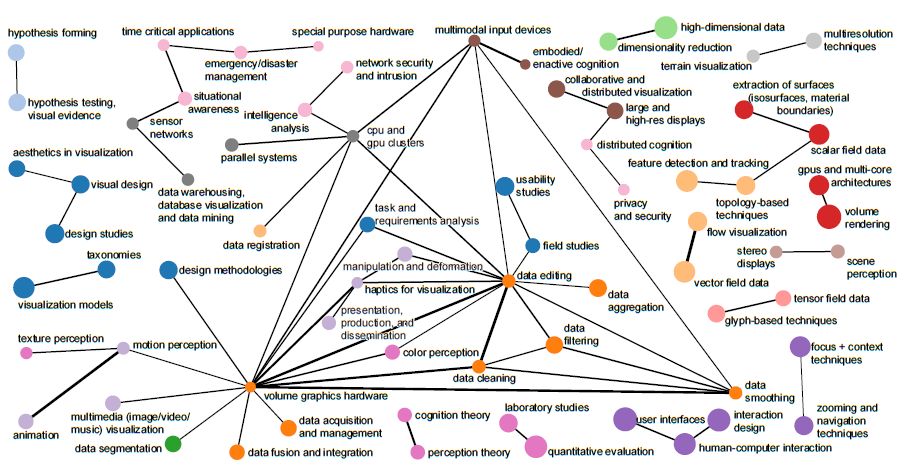
Visualization is an extremely divers area of research with various influences. A recent paper has attempted to understand the field based on the keywords provided with this dataset. However, there are many other ways in the dataset can help us understand what the field looks like. For example:
- a similar analysis but looking at paper titles and/or abstracts,
- a more in-depth analysis on temporal evolution of the field (e.g. the researchers joining and leaving, topics trending and declining, ...)
- the evolution of the individual sub-conferences Vis/SciVis, InfoVis, and VAST
Here an example of a keyword co-occurrence map. What other graphics can be provide to help understand the Visualization community:
Potential research questions on this topic is, thus:
- What are current and/or historic trends in the Visualization community?
- How can we best describe the work conducted in the community?
Supporting Paper Writing
When writing a scientific paper, it is important to have an up-to-date background section in which the most important related articles can be found. Our dataset could be a good source for finding relevant related work.
Here an example extract of a related work section. The numbers in brackets refer to papers listed at the end of the paper in the bibliography section: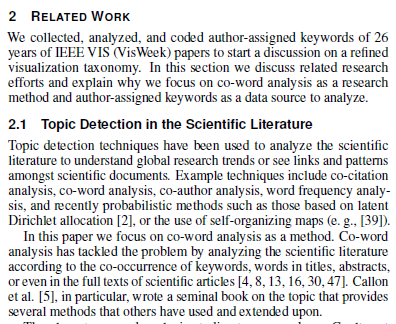
One potential research question on this topic is, thus:
- What are the most important related papers on a given topic? Can we suggest relevant literature by going beyond a simple text search on keywords, titles, and texts?
Supporting Conference Organization
The IEEE VIS conference is organized by a huge number of people who serve in various committees. One of these committees is called the program committee. The program committee includes a large number of people who serve as the primary reviewer for a number of papers (usually about 7 per person) submitted to the conference. The primary reviewer is a particularly important reviewer as he/she makes the final recommendation to the papers chairs about accepting or rejecting a submitted paper. As such, the program committee is made up of people who have published a number of papers at the conference already and, thus, have experience in the domain. However, building a program committee is not an easy task as a number of factors need to be balanced. Ideally you would like to have people:
- with at least three years of expertise in the field (based on publications)
- who are from a variety of affiliations
- who are a mix of male and female
- and who represent a variety of research topics
Here a picture showing a subset of the people on the IEEE InfoVis 2016 program committee:
One potential research question on this topic is, thus:
- What would be a recommended program committee based on the publication data. Note that InfoVis, SciVis/Vis, and VAST each have separate program committees.
Understanding Citation Behavior
Each scientific paper includes a list of references at the end. In our dataset we have listed a set of references to other IEEE VIS papers in the dataset. It would be interesting to understand general citation behavior, such as is there an influence on time, affiliation, or authors and co-authors on which papers are cited?
For an example of a related project check ut CitNetExplorer:
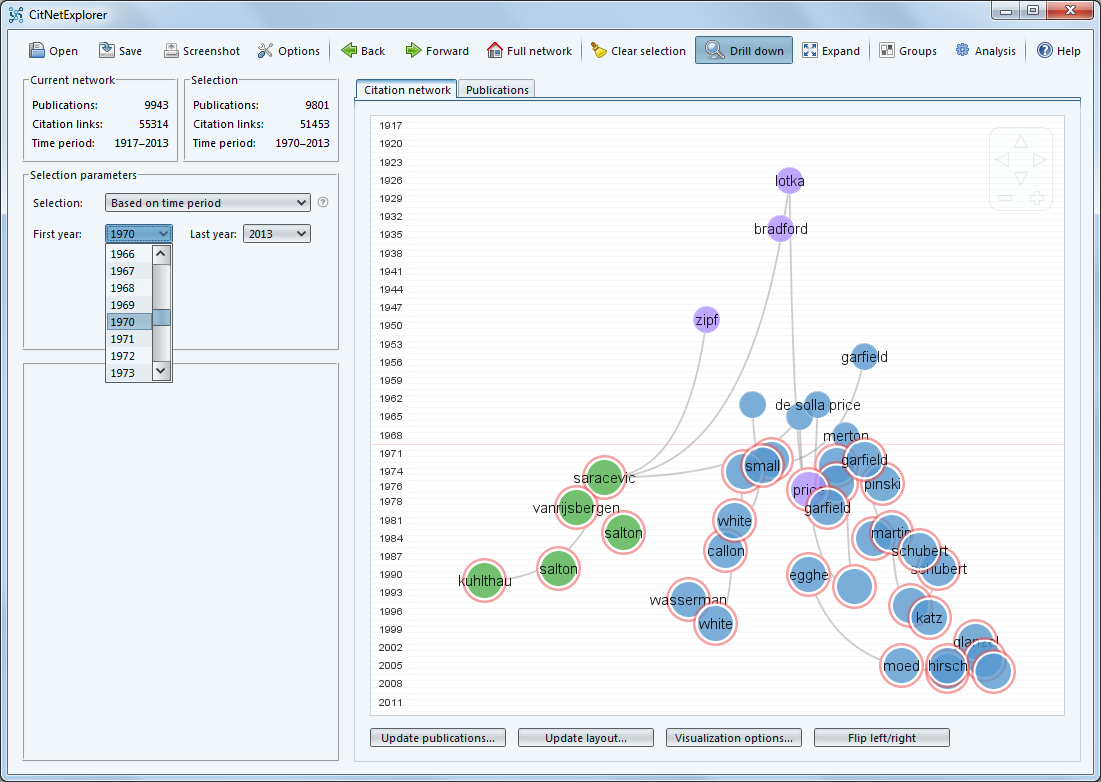
One potential research question on this topic is, thus:
- What are typical citation patterns for IEEE VIS papers
In-class exercise
Create a Website that loads your tutorial sketch (the P5 editor will do this for you automatically). The tutorial sketch should be loading the vispubdata-Grobid-min.csv Δ file. By the end of the tutorial you should be able to display a line for each paper in the data file and modify some properties of this line.
Assignment
Based on the research question you chose from above, choose one entity in your dataset that is important to you. This could for example be the authors, papers, keywords, years, etc.
For each of - or an aggregation of - these entities do the following:
- choose a visual mark to display the data items.
- choose a minimum of two visual variables - other than color hue - to display at minimum two different pieces of information for each data item (e.g. in your tutorial example above this could be the year of each paper and the number of authors - or many other things).
- load a data file that contains the data you need to display - if you don't have a data file that contains your information, create it. You can use tools such as R or OpenRefine (or ask your TA in case of questions)
- implement a P5 sketch that draws your data items and their two values (again, do not use color hue - we will start using color after the perception lecture)
- create - or have the P5 editor create - a .html file that I can open to run your sketch. On this website add additional text to tell us what data items you encoded and which mark and visual variables you used to encode which information. On this website also cite sources if you copied code from external sites or examples (this is fine to do - as long as the sources are acknowledged).
Look up the lecture slides for this week's introduction to visualization if you do not understand the terms visual mark and visual variable.
Submitting the Assignment
WHAT - Create a folder called "YOUR_LASTNAME-Assignment1" and put all your files in it. Make a single ZIP file called "YOUR_LASTNAME-Assignment1.zip" and submit it via email. It should contain:
- Your sketch and the website as described above. Make sure that your code runs. We will be using Firefox to look at the visual result of your exercise.
- Make sure the data file is submitted in the data folder as explained in the tutorial
- Also submit a 300x300px thumbnail screenshot of your solution called thumbnail.png. The thumbnail will be used on a website where all solutions of all students will be collected and made available. Do not put any identifying information on your html page if you do not want to be identified.
WHERE - You should email the file to lonni.besancon@gmail.com with the subject InfoVis Assignment1.
WHEN - Assignment 1 is due before "23:00 on Tuesday, November 29th.'''
License
You can reuse this content for your class if you acknowledge us (Petra Isenberg): 