Description
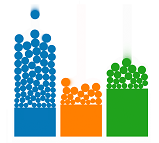
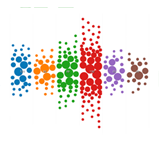
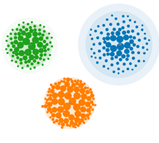
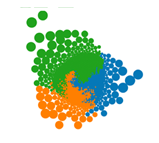
Visual sedimentation is a novel design metaphor that progressively generates and updates visualizations of streaming data, inspired by the process of physical sedimentation. This process is the result of objects falling due to gravity forces, that aggregate into compact layers over time. The process is well understood since our environment is shaped by sedimentation: mountains, hills or rivers are the visible result of this long process. Our goal is to apply metaphorically those physical properties to visualizations, where new elements are the equivalent of the falling objects that progressively aggregates into layers made of the aggregation of previous elements visually represented as solid shapes.
The metaphor is appropriate to monitoring tasks on data such as streams of tweets or stream of network data that requires a quick overview about what is being said, detecting anomalies or just being aware of what happened recently. These data streams can be unpredictable in frequency, implying flexible visualizations.
Download it and test it
Visual Sedimentation is an open source javascript library available on github.
Articles
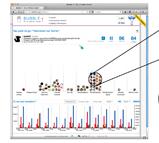
Huron, S., Vuillemot, R., and Fekete, J. 2013. Visual Sedimentation. Paper at VIS'13 (Atlanta, USA, 2013).
Huron, S., Vuillemot, R., and Fekete, J. 2012. Towards Visual Sedimentation. Poster at Infovis'12 (Seattle, USA, October 14 - 19, 2012).
    @article{huron:hal-00846260,
        url = {http://hal.inria.fr/hal-00846260},
        title = {{Visual Sedimentation}},
        author = {Huron, Samuel and Vuillemot, Romain and Fekete, Jean-Daniel},
        affiliation = {AVIZ - INRIA Saclay - Ile de France , Institut de Recherche et d'Innovation - IRI},
        publisher = {IEEE},
        journal = {IEEE Transactions on Visualization and Computer Graphics},
        audience = {internationale },
        year = {2013},
        month = Nov,
    }

    @article{huron2012towards,
      title={Towards Visual Sedimentation},
      author={Huron, S. and Vuillemot, R. and Fekete, J.D.},
      journal={VisWeek 2012 Electronic Conference Proceedings},
      year={2012}
    }
Examples
All this exemple have been tested with Google Chrome v.18. Use preferably a Google Chrome browser at its latest version. Index of exemple
 |
 |
 |
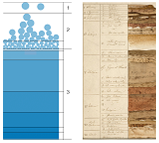 Fig.2 metaphor |
 |
 |
|---|---|---|---|---|---|
 |
 |
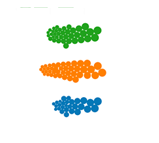 |
 Fig. A4 corner |
 Fig. A5 dropBarChart |
 |
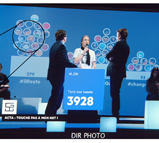
Application Videos
Others related projects
Contacts
- Samuel Huron, INRIA and IRI
- Romain Vuillemot, INRIA
- Jean Daniel Fekete, INRIA
Acknowledgement
We thank CINEGIFT DGCIS project and ANR Periplus for the fund- ing; And also France Televisions Innovation, Allo Cine and Google who hosted some of our case studies; Also the IRI team: Nicolas Sauret, Raphael Velt, Yves Marie Haussonne, Vincent Puig; Lindsay MacDonald, Jagoda Walny, Laurence Fyfe and Lora Oehlberg for their help in improving the article.