Hybrid-Image Visualizations
Researchers
- Petra Isenberg (Aviz)
- Pierre Dragicevic (Aviz)
- Wesley Willett (Aviz)
- Anastasia Bezerianos (In-Situ, U-PSud/INRIA/CNRS)
- Jean-Daniel Fekete (Aviz)
Overview
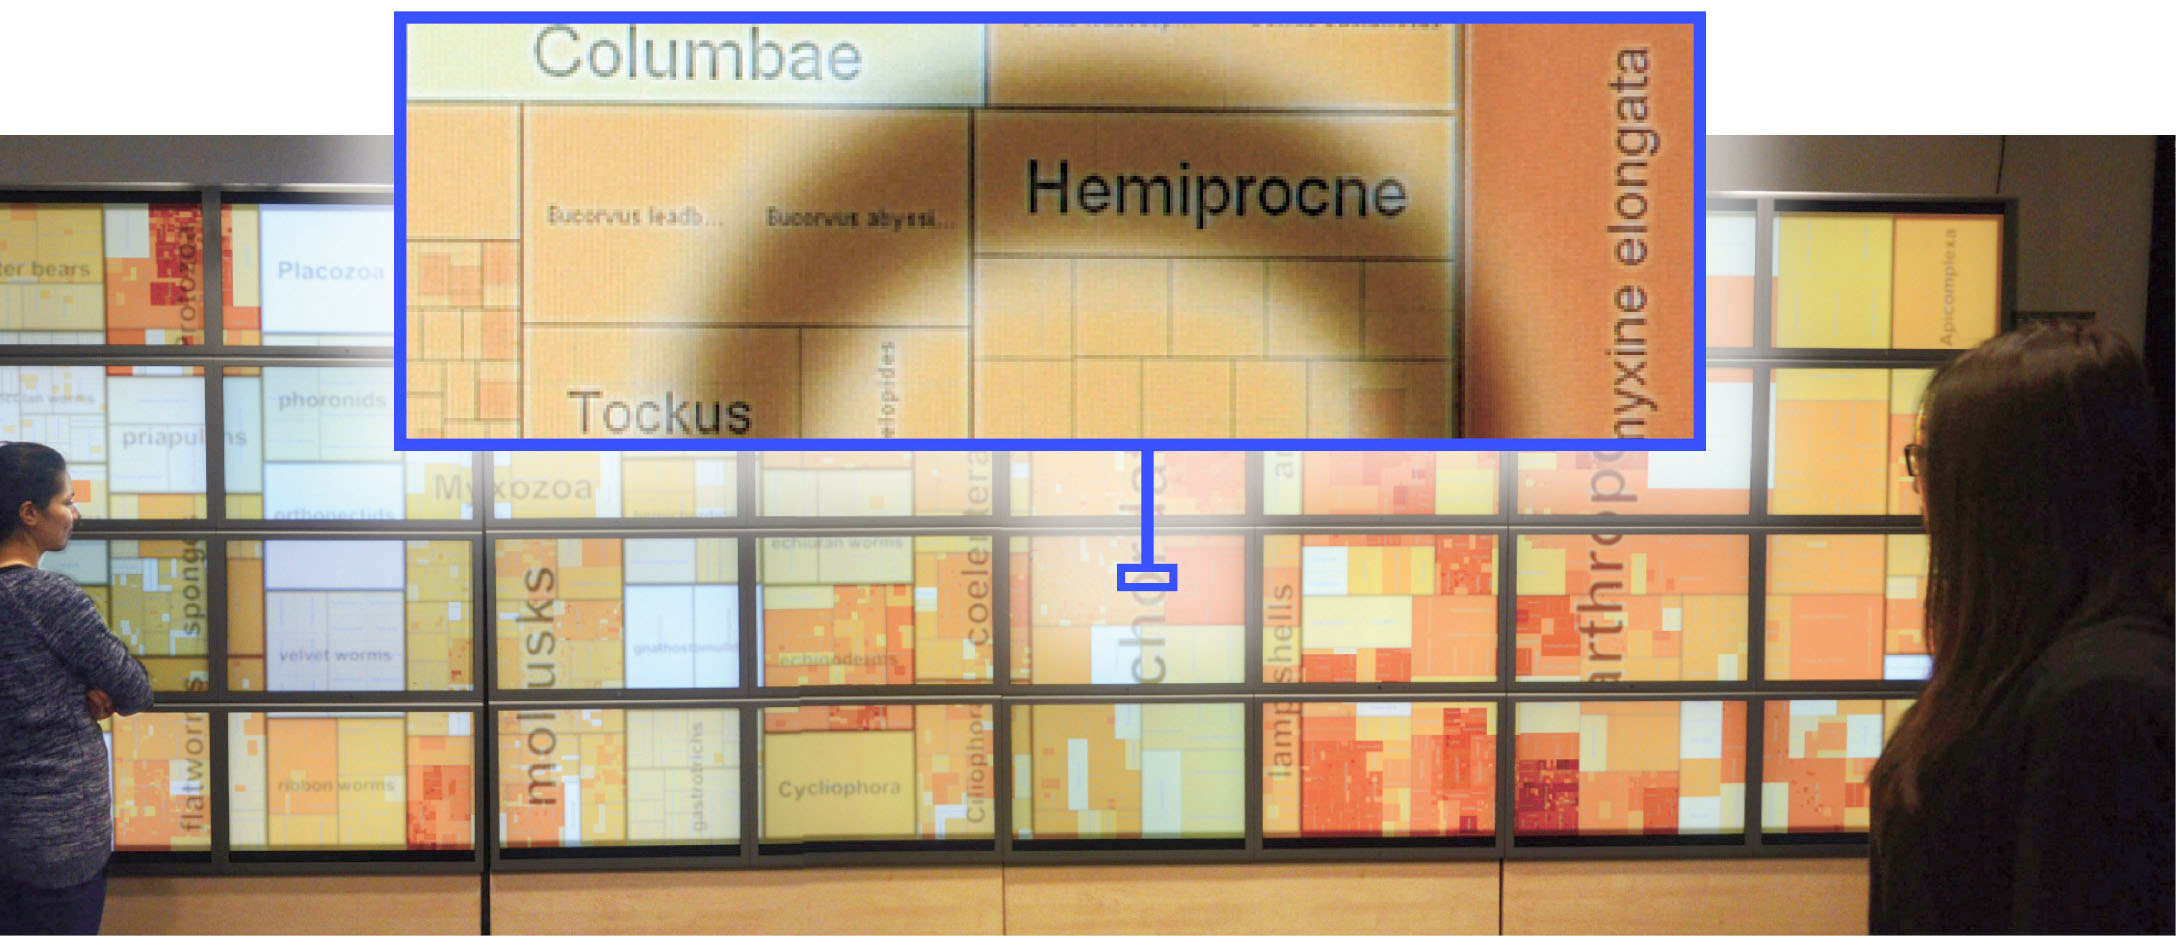
We present a first investigation into hybrid-image visualization for data analysis in large-scale viewing environments. Hybrid-image visualizations blend two different visual representations into a single static view, such that each representation can be perceived at a different viewing distance. Our work is motivated by data analysis scenarios that incorporate one or more displays with sufficiently large size and resolution to be comfortably viewed by different people from various distances. Hybrid-image visualizations can be used, in particular, to enhance overview tasks from a distance and detail-in-context tasks when standing close to the display. By taking advantage of humans’ perceptual capabilities, hybrid-image visualizations do not require tracking of viewers in front of a display. Moreover, because hybrid-images use a perception-based blending approach, visualizations intended for different distances can each utilize the entire display. We contribute a design space, discuss the perceptual rationale for our work, provide examples and a set of techniques for hybrid-image visualizations, and describe tools for designing hybrid-image visualizations.
Publications
Hybrid-Image Visualization for Large Viewing Environments Petra Isenberg, Pierre Dragicevic, Wesley Willett, Anastasia Bezerianos, Jean-Daniel Fekete IEEE Transactions on Visualization and Computer Graphics, Institute of Electrical and Electronics Engineers, 2013, 19 (12), pp.2346--2355.
Images
The technique was designed for our wall-sized display, so images are very very large and likely not as effective on a regular desktop - or even smaller - screen.
WILD WALL
The pictures linked to below are optimized for the WILD wall in our research institute. This wall is 5.5 x 1.8m large and consists of 8x4 30'' Apple Cinema Displays at 2560x1600 resolution each. The images thus have a resolution of 20480 x 6400 = 131 million pixels.
- You can interactively zoom into several different images here: http://aviz.fr/hybridexamples/
- A hybrid-image treemap (92MB) - this treemap shows the "classif_A_03-04-16.ivc" dataset from the InfoVis 2003 contest showing a classification of living organisms in the Animal Kingdom, Animalia. The tree has roughly 200,000 nodes and as you can see not even our wall is big enough to show them all.
- A Hertzsprung-Russell Diagram (17MB) - the Hertzsprung-Russell diagram is a scatterplot of star on a graph measuring the star's absolute magnitude (brightness) against its temperature (color). The color coding is redundant. Zoom in to see some star labels.
Video
Summary Video
Videos for Presentations
The following a short screencaptures of a simulation of walking towards and away from our large WILD display showing a hybrid image visualization. The videos capture a smooth zoom into a gigapixel hybrid image.
- Zoom into a hybrid-image temperature plot (wmv - for ppt)
- Zoom into an alpha-blended temperature plot (wmv - for ppt) (this is NOT a hybrid image vis, look at it in contrast to the video above)
- Zoom into a hybrid-image treemap (wmv - for ppt)
- Zoom into a hybrig-image Hertzsprung Russell Diagram (wmv - for ppt)
Simulation
The gigapixel image viewer below lets you simulate walking towards and away from our display wall.
Presentations
(PDF slides, videos not included)
- Presentation held at IEEE InfoVis 2013 by Petra Isenberg and Pierre Dragicevic
- Extended presentation given at Vialab by Petra Isenberg and Pierre Dragicevic. Thanks to Chris Collins for organizing the visit and seminars.
Software
The software for reproducing our results or for making your own hybrid images or hybrid visualizations can be found here: https://github.com/INRIA/hybridvis
Links
License
All material on this page is CC-BY-SA. If you reuse or adapt the material please reference our article above and/or link to this page.

