GraphCuisine
Description
GraphCuisine lets users steer an Evolutionary Algorithm (EA) to create random graphs that match user-specified measures. Generating random graphs with particular characteristics is crucial for evaluating graph algorithms, layouts and visualization techniques. Current random graph gen- erators provide limited control of the final characteristics of the graphs they generate. The situation is even harder when one wants to generate random graphs similar to a given one, all-in-all leading to a long iterative process that involves several steps of random graph generation, parameter changes, and visual inspection. Our system follows an approach based on interactive evolutionary computation. Fitting generator parameters to create graphs with pre-defined measures is an optimization problem, while assessing the quality of the resulting graphs often involves human subjective judgment. In this paper we describe the graph generation process from a user’s perspective, provide details about our evolutionary algorithm, and demonstrate how GraphCuisine is employed to generate graphs that mimic a given real-world network.
Publication
Benjamin Bach, André Spritzer, Evelyne Lutton, Jean-Daniel Fekete. Interactive Random Graph Generation with Evolutionary Algorithms. Graph Drawing, Sep 2012, Redmond, United States.
Download
>>New version available
Download GraphCuisine version 0.9.5 (all platforms).
For contact: see end of page.
Quick Manual
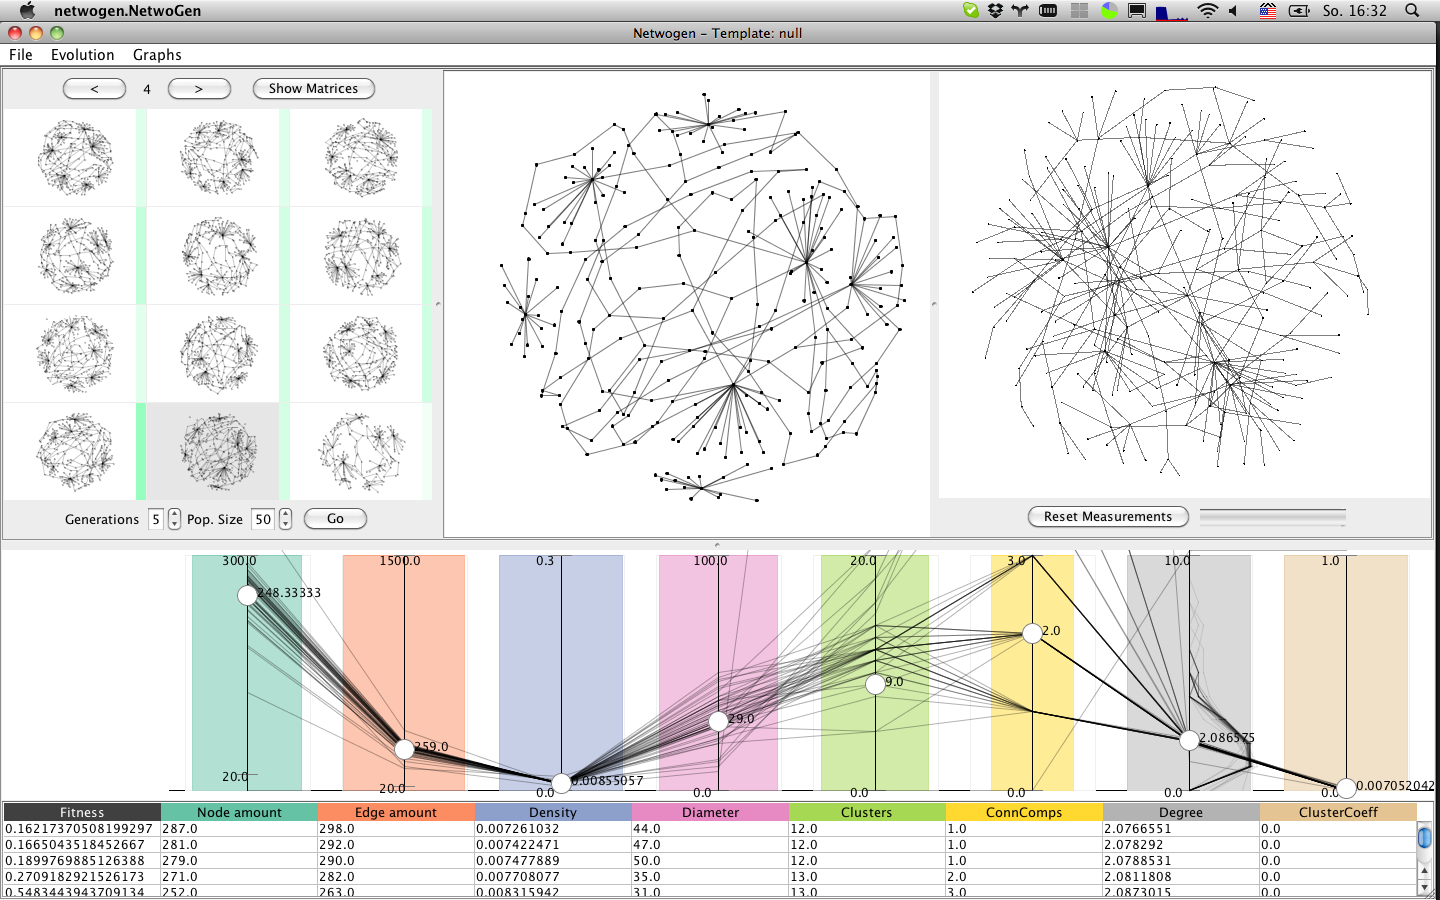
Interface
Population panel
The population panel shows a representative selection of graphs from the current population. Hovering over a graph, the distribution of this graph is highlighted in the measurement panel, as red line.
Generator panel
The generator panel is a simple checkbox panel which allows to enable and disable graph generators.
Measure panel
The measure panel shows each measure as vertical line in a parallel coordinates plot (PCP). The target measures towards which the are shown as white knobs, while other polylines represent all graphs in the population, even those not shown in the graph panel.
Import panel
Shows the imported graph.
Detail panel
Shows the graph currently selected (clicked) in the population panel.
Start
Import and mimic
To mimic an existing data set, you first import it and then run several evolution cycles until the results is satisfying.
- New > New by Graph
- Wait for population initialization
- Select graph file
Generate from Scratch
You can generate graphs from scratch by defining the target measures explicitly. You start by a random population, set the desired target measures and run as many evolution cycles you want.
- New > New Random Initialization
Generate from Template
GraphCuisine provides several predefined target measure and generator settings (Chromosomes) which produce graphs which certain predefined characteristics. Using templates can save time in evolution and setting target measures. Just select a template from the list and wait for the population to show up.
Current templates are:
- Sparse graph
- Dense graph
- Uniform Graph
- Small world graph
- New > New from Template
Interaction
Adapt measures
- Move white knobs (drag an drop) in measurement panel (Parallel Coordinates Plot)
- Change importance of measure (drag and drop) of colored bars. If the importance is close to 0 (very very thin colored line) the measure is not calculated, which in turn saves time).
Graph Selection
- Select graphs from population panel. The system interferes what measures you are most interested in, by giving more weight to those which are common across all selected graphs.
Adapt Evolutionary Algorithm
- Change population size: The larger the population, the longer it takes to generate a new generation, but the higher the variety and probability of good solutions.
- Change number of automatic generations: The more automatic generations, the better the results you will see. However, run more generations takes longer time.
Export
There are two strategies to export graphs. Exported graphs will be saved as csg(Comma seperated graphs), a simple CSV based format to describe graphs.
- You export only the graph you actually selected. When selecting Graphs > Export Graphs you are asked to select a file and then how many graphs you like to export. Simply type 1.
- You can export an arbitrary number of graphs similar to the one you selected. After Graph > Export graphs and select a file name, you type the number of graphs you want to export. GraphCuisine then creates the desired number of graphs from the chromosome of the graphs you selected and stores them in a directory with the name you entered prior. The graph files are numbered, starting with 0.
>> For more more information, please have a look at the paper or contact the authors (end of page).
Generators
| Generator | Description | Parameters |
| Cluster | Create dense subgraphs. | Number of clusters (integer), ideal cluster size (integer), size variability (double), density (double). |
| Path | Sequence of nodes in which there is always an edge from one node to the next. | Number of paths (integer), ideal path length (integer), length variability (double). Star and end nodes are chosen randomly from the graph. |
| Cycle | Closed path. The start/end node is an existing node. | Number of cycles (integer), ideal cycle size (integer), size variability (double). |
| Star | Tree with one central node and a given number of leaves. & Number of stars (integer), ideal central node degree (integer), central node degree variability (double). | |
| Edge Noise | Adds edges linking randomly chosen nodes. | Ideal number of edges the graph should have (integer). |
| Eppstein Wang Power Law Noise | Adds or removes edges according to the model by Eppstein. | Number of iterations (integer). |
| Exponential Edge Noise | Adds edges while trying to achieve an exponential degree distribution. | Ideal number of edges the graph should have (integer). |
| Logarithmic Edges | Adds edges while trying to achieve a logarithmic degree distribution. | Ideal number of edges the graph should have (integer). |
| Node Noise | Adds nodes until the target count for the graph is reached. | Ideal number of nodes the graph should have (integer). |
| Orphan Cleanup | Removes nodes with degree 0. | Percentage of orphans to be removed (double). |
| Random Edge Cleanup | Removes randomly chosen edges. | Percentage of edges to be removed (double). |
| Random Node Cleanup | Removes randomly chosen nodes. | Percentage of nodes to be removed (double). |
People
Please, to ask questions and send comments, e-mail co-authors:
- Benjamin Bach
- Andre Spritzer
- Evelyne Lutton
- Jean-Daniel Fekete