
Connect, Collaborate, Analyze : From Individual Work to Collaborative Visual Analytic (FITOC)
Project Details:
| Project Code: | ANR- 11-JS02-003 |
| Program: | JCJC 2011 |
| Duration: | 01/10/2011-30/09/2015 (extended due to two maternity leaves by the PI until 31/7/2016) |
| Researchers: | Petra Isenberg (PI), Pierre Dragicevic, Jean-Daniel Fekete, Wesley Willett, Pascal Goffin |
| Research Themes: | Information Visualization, Visual Analytics, Computer-Supported Cooperative Work, Human-Computer Interaction |
Project Description
The goal of this project is to help bringing collaboration to existing individual visual data analysis work. It is situated in the domain of information visualization, a subdomain of computer science, but views and tries to support data analysis as a social process. The work is motivated by the fact that a large amount of data analysis work is conducted by individuals in isolated tool, such as Excel, R, SPSS, Tableau, and others. Synthesis and sharing of the results then happens in another set of tools such as notes, email, or office documents. The research is situated in the domain of visualization which has a long tradition of building tools and techniques for individual data analysis. Currently there are technological innovations under way to help people analyze data together, but there is still a disconnect between the two modes of data analysis (collaborative and individual). In this project, we want to find ways in which information can best be used and shared visually while transitioning between individual and collaborative data analysis activities.
Historical Evolution of the Project
Phase 1: Gathering Software Requirements
At the start of the project, no software toolkit existed that included encompassing features for collaboration & visualization development. Either toolkits included (some) groupware features and low-level graphics or (different degrees of) visualization development aid. In particular, it was also evident that the information visualization community was moving visualizations to the web which was important for us because web visualization are intended for sharing but target a different audience (general users vs. power users).
We found that there was no unified understanding on what components a toolkit should include in order to support collaboration + visualization. We first need to develop a better understanding of the design space in order to abstract to toolkit requirements.
Phase 2: Prototype Development
Next, we set out to explore the problem space of interaction between single-user and collaborative work by choosing two different scenarios. Our goal was to get to know different collaboration and visualization requirements.
Scenario1: Tangibles to support transition between individual and collaborative work
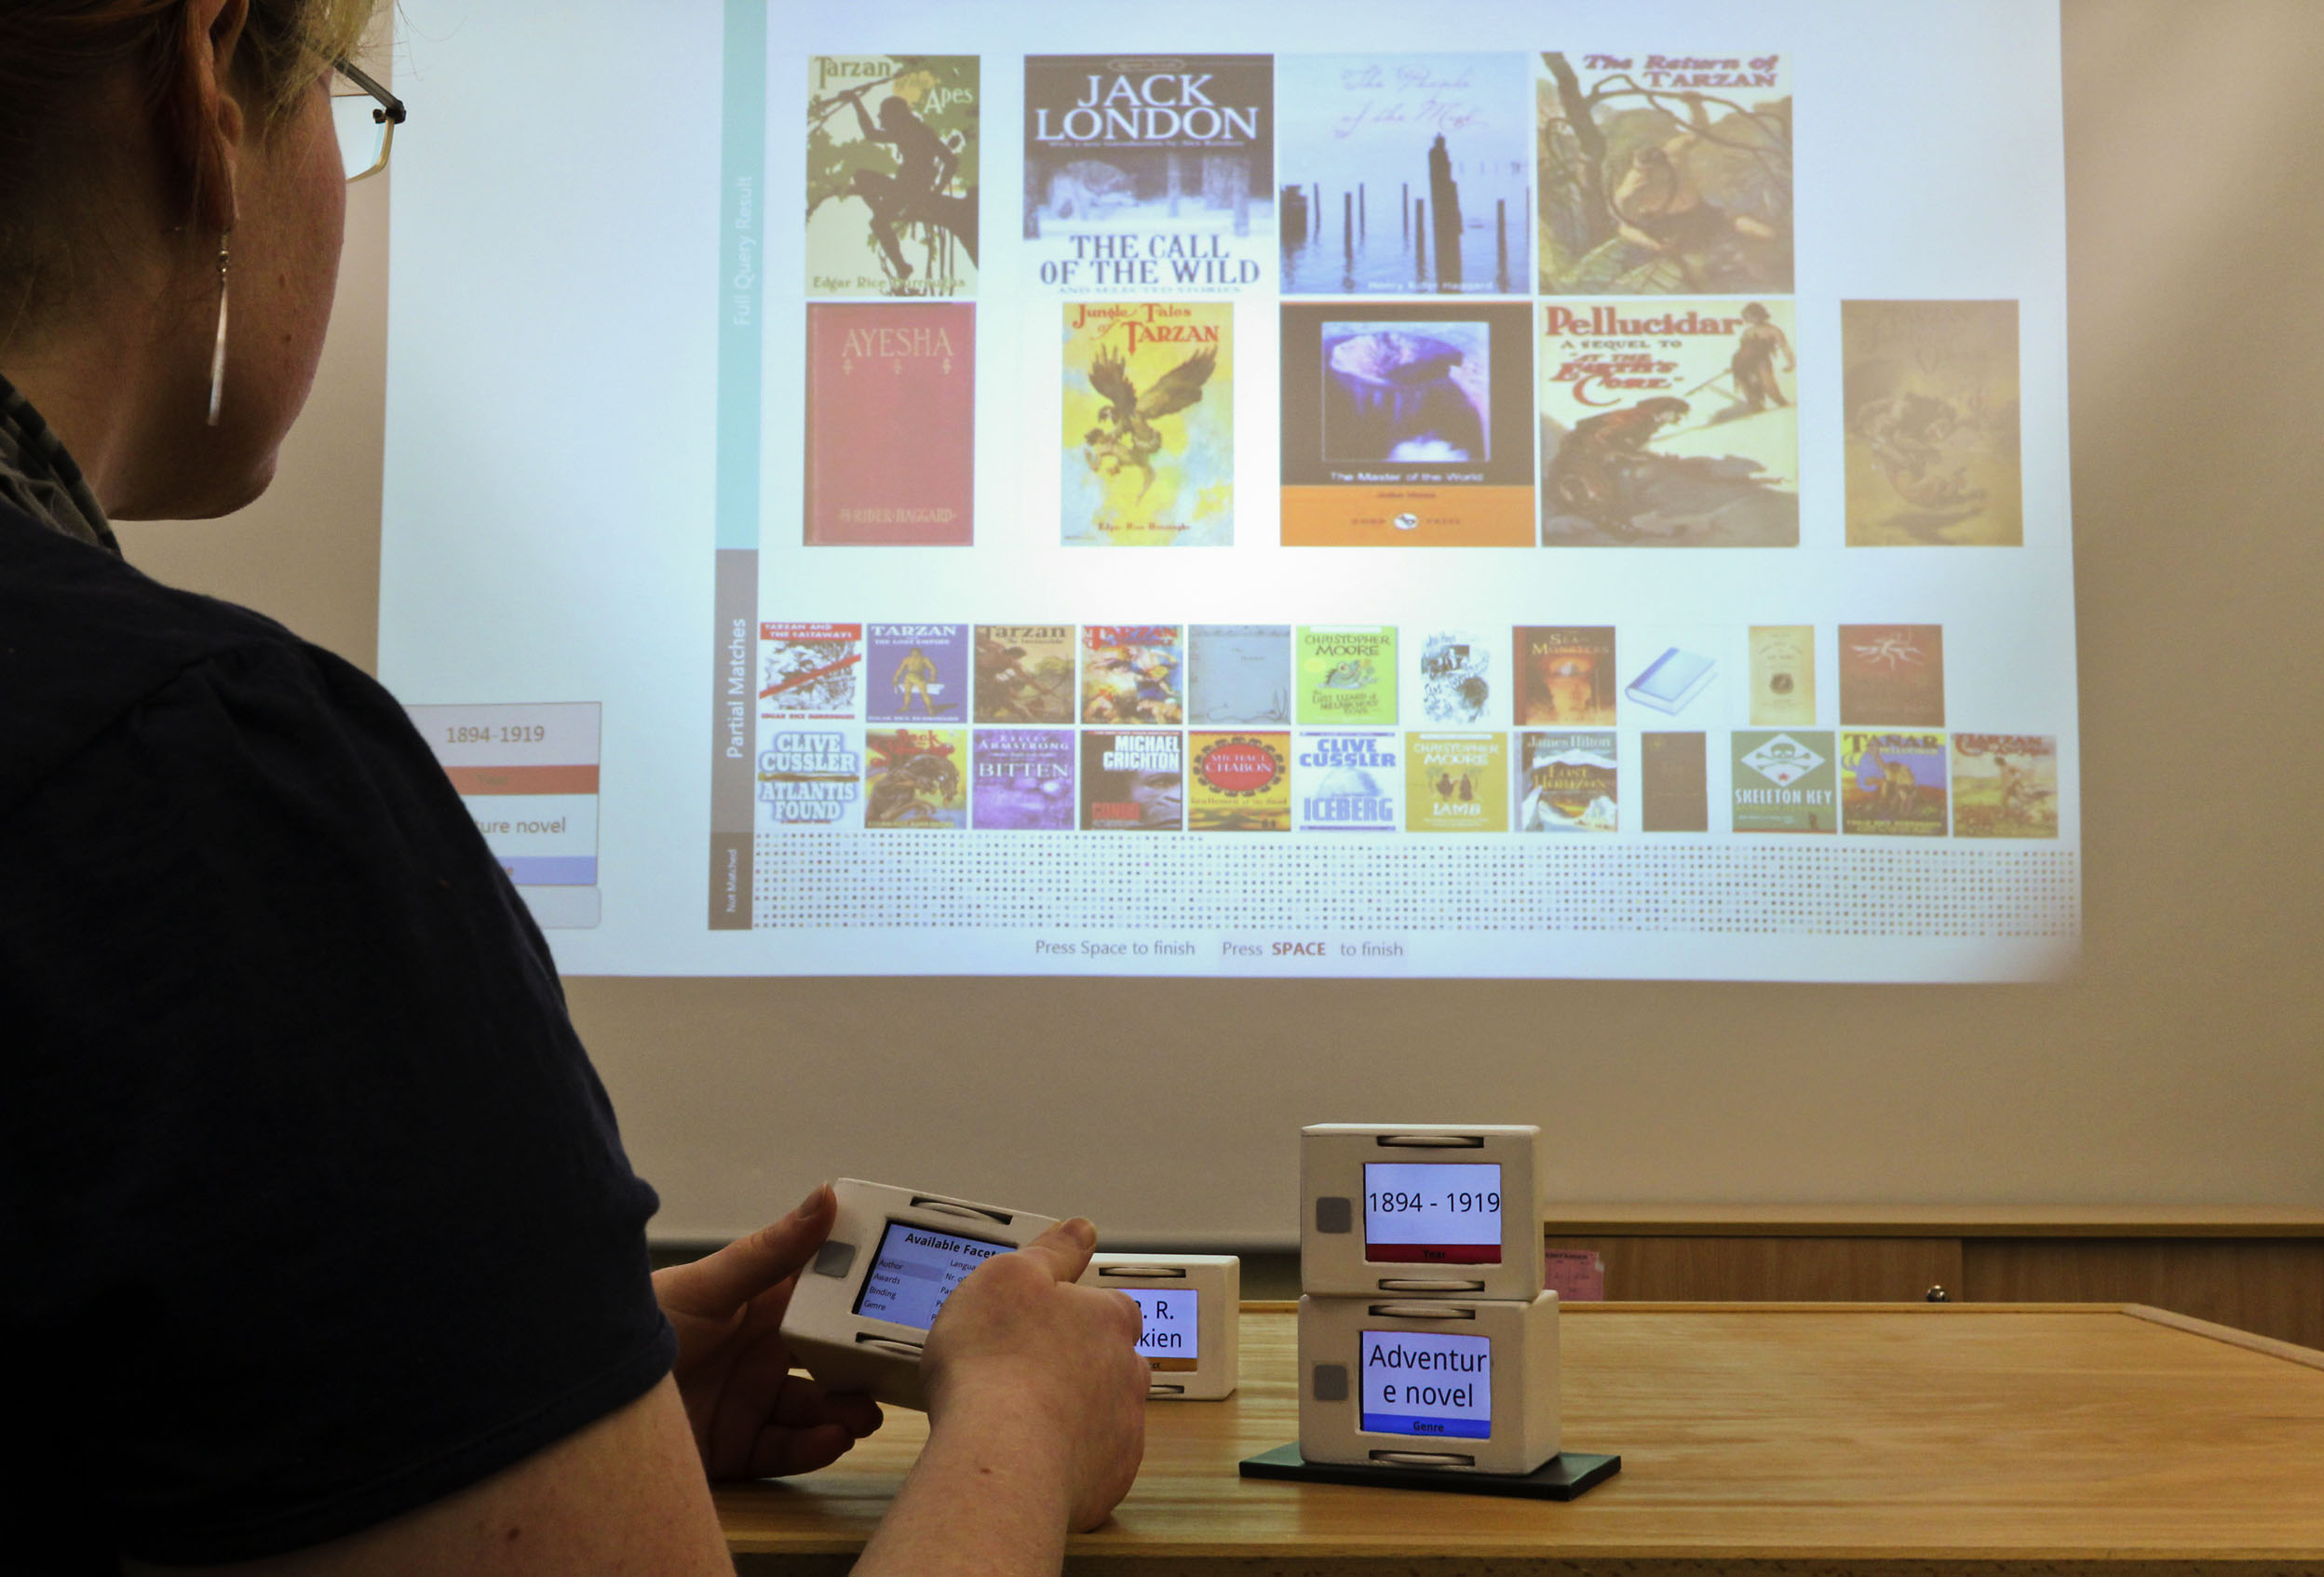 | We were working on understanding how tangibles can be used to ease the transition between individual and collaborative work. This project focused on tangibles to support faceted search/browsing. More detail on this project can be found on the Stackables project page |
Scenario 2: Utilizing perception to support merging individual visual representations for collaborative and single work
 | We were working on methods that the merging of data from multiple people to be viewed at multiple distances. More detail on this project can be found on the hybrid image visualization project page |
From work on Phase 2 we found that collaboration requirements for co-located work are extremely diverse and highly context specific. Building software toolkits that support both collaborative as well as individual work well would also have to be very specific to hardware setup (such as physical props to help consolidate visualization parameters vs. perception-based approaches to merge visualizations). Therefore, we chose to focus on a specific application scenario to develop more concrete requirements and develop first support libraries.
Phase 3: Supporting sharing notes and data visualizations for individual and shared asynchronous work
Handwritten notes, while expressive, are difficult to copy, search, organize, share, and archive. In response, over the past several decades, an increasingly large proportion of notetaking has begun to take place via digital tools. We chose note-taking as an application domain for studying sharing data from individual to shared asynchronous or even synchronous work.
To better understand practices and limitations surrounding digital notes, we first contributed what we believe is one of the first detailed studies of real-world digital note-taking in a widely-used commercial tool. Based on our findings, we explore how information visualization techniques can be used to support reflection, organization, and collaboration around digital notes. Finally, we present implications for the design of note visualization tools.
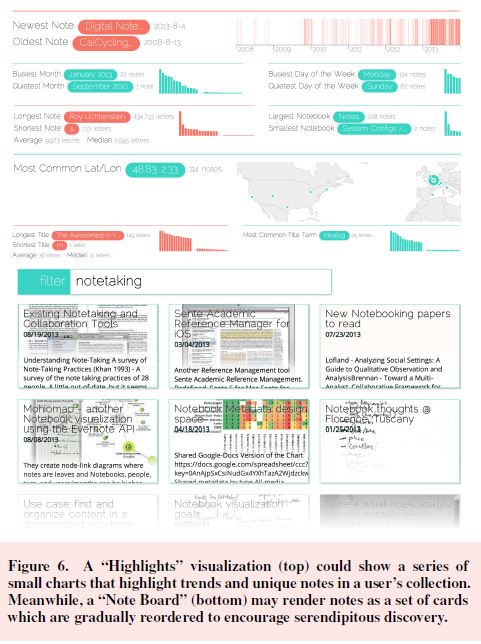
We found that the structure of notes is important to remembering and sharing the content. We also found, that people do easily get lost in their notes and it is difficult for them to see structure in a larger set of notes. From these findings, the challenge arose to find lightweight forms of sharing meta-information about the content of notes or highlighting content in notes. Our research quickly channeled towards exploring sharing and documenting note content using word-scale visualizations.
Word-scale visualizations  are small-scale visualizations that can be used inline in text documents to represent data. Our research focused on: how these visualizations can be used and designed - following a qualitative study with 9 designers, how they can be placed in documents, how they can be interacted with - and finally how they can be used to share information between collaborators. We are still actively working on this part of the project and hope to finish the final publication by the end of 2016.
Here is a video advertising research conducted as one sub-project in this phase of the project:
are small-scale visualizations that can be used inline in text documents to represent data. Our research focused on: how these visualizations can be used and designed - following a qualitative study with 9 designers, how they can be placed in documents, how they can be interacted with - and finally how they can be used to share information between collaborators. We are still actively working on this part of the project and hope to finish the final publication by the end of 2016.
Here is a video advertising research conducted as one sub-project in this phase of the project:
and a video of one of our conference presentations
Additional Material
- An overview and categorization of word-scale visualizations created as part of an exploratory user study with 9 designers
Positions
Both the PhD and the engineering position for this project have been filled.
Publications From This Project
General overarching publications
From the Individual to the Group: Integrating Asynchronous Collaboration with Co-located Work
Petra Isenberg, Jean-Daniel Fekete
Proceedings of the AVI Workshop on Supporting Asynchronous Collaboration in Visual Analytics Systems, May 2012, Capri, Italy. Published online, 2012
For the work on tangible data sharing
Stackables: Faceted Browsing with Stacked Tangibles
Petra Isenberg, Stefanie Klum, Ricardo Langner, Jean-Daniel Fekete, Raimund Dachselt
Conference on Human Factors in Computing Systems (CHI Interactivity), May 2012, New York, NY, United States. ACM, pp.1083--1086, 2012
Stackables: Combining Tangibles for Faceted Browsing
Stefanie Klum, Petra Isenberg, Ricardo Langner, Jean-Daniel Fekete, Raimund Dachselt
Advanced Visual Interfaces (AVI), May 2012, New York, NY, United States. ACM, pp.241--248, 2012
For hybrid image visualizations
Hybrid-Image Visualization for Large Viewing Environments
Petra Isenberg, Pierre Dragicevic, Wesley Willett, Anastasia Bezerianos, Jean-Daniel Fekete
IEEE Transactions on Visualization and Computer Graphics, Institute of Electrical and Electronics Engineers, 2013, 19 (12), pp.2346--2355.
For embedding visualizations in text-documents and note sharing
Sharing Information from Personal Digital Notes using Word-Scale Visualizations
Pascal Goffin, Wesley Willett, Petra Isenberg
Proceedings of the IEEE VIS Workshop on Personal Visualization: Exploring Data in Everyday Life, Oct 2015, Los Alamitos, CA, United States. <www.vis4me.com/personalvis15/index.html>
Design Considerations for Enhancing Word-Scale Visualizations with Interaction
Pascal Goffin, Wesley Willett, Jean-Daniel Fekete, Petra Isenberg
Posters of the Conference on Information Visualization (InfoVis), Oct 2015, Los Alamitos, CA, United States. IEEE
Exploring the Effect of Word-Scale Visualizations on Reading Behavior
Pascal Goffin, Wesley Willett, Anastasia Bezerianos, Petra Isenberg
Extended Abstracts of the Conference on Human Factors in Computing Systems (CHI), 2015, New York, NY, United States. ACM,
Understanding Digital Note-Taking Practice for Visualization
Wesley Willett, Pascal Goffin, Petra Isenberg
IEEE Computer Graphics and Applications, Institute of Electrical and Electronics Engineers, 2015, 35 (4), pp.38--51.
Exploring the Placement and Design of Word-Scale Visualizations
Pascal Goffin, Wesley Willett, Jean-Daniel Fekete and Petra Isenberg
IEEE Transactions on Visualization and Computer Graphics (Proceedings Scientific Visualization / Information Visualization 2014), vol. 20, no. 12, Dec. 2014.