Additional Material for 'Evaluating the Efficiency of Physical Visualizations'
This page contains additional material for facilitating the re-analysis, meta-analysis, and replication of our study on physical visualizations. If you have questions, feel free to e-mail us.
 | All material on this page is CC-BY-SA. If you reuse or adapt it please reference our article and/or link to this page. |
Experiment 1
Effect Sizes
Results of post-hoc pairwise comparisons between techniques measured as ratios of average times for all tasks, with 95% confidence intervals.
| Techniques | Ratio | 95% CI |
|---|---|---|
| physical / mono | 0.821 | [0.701, 0.951] |
| physical / stereo | 0.801 | [0.729, 0.881] |
| 2D / physical | 0.623 | [0.554, 0.700] |
| 2D / mono | 0.511 | [0.466, 0.560] |
| 2D / stereo | 0.498 | [0.440, 0.565] |
| mono / stereo | 0.976 | [0.866, 1.101] |
Participant logs
Download file: exp1-userlogs.zip
This zip file contains:
- The original participant logs of the 1st experiment in the plist XML format (see http://en.wikipedia.org/wiki/Property_list), one plist file per user
- The file userlogs.csv that combines all logs in a single CSV file for analysis
- The file questionnaire.csv that contains participants' answers to the questionnaire
The columns in userlogs.csv are:
- 1 subject: Subject's number, encoded in the plist file.
- 2 subjectname: Subject's name, extracted from the filename.
- 3 group: The group number, computed by taking subject number (above) modulo 4.
- 4 infovisbackground: Indicates whether this person is working in the infovis field.
- 5 conditionrank: The rank of the condition (block?) according to the order of the experiment, starting from 1 and ending with 4.
- 6 modality: The modality involved in the condition, defined by a number.
- 7 modalityname: The name of the modality involved in the condition.
- 8 repetition: The repetition number, initialized to 1 when a new condition starts, and incremented with each new dataset presented.
- 9 datasetname: The name of the dataset used in this repetition.
- 10 trial: The global trial number within the experiment (1-32).
- 11 question: The question number in order of appearance, initialized to 1 when a new repetition starts.
- 12 tasktype: The type of task captured by the question.
- 13 inputtype: The type of input required by the question.
- 14 readingTime: The users' time to read the question.
- 15 error: The error in the question's answer, from 0 (exact answer) to 1 (worst possible answer).
- 16 time: Task completion time in seconds, from the press on Start to pressing Done.
- 17 logtime: Task completion time in log of seconds, from the press on Start to pressing Done.
Datasets
Download file: exp1-datasets.zip
This zip file contains the datasets of country indicators used in our 1st experiment.
Each dataset consists in:
1 - A CSV file with the value of the country indicator for each country and year (10 countries and 10 years, 100 values total). The data is from gapminder.org.
2 - A metadata XML file which specifies:
- The full name of the country indicator,
- The min and max axis values (computed using the axis labelling algorithm from Talbot et al),
- The axis tick values (computed using the axis labelling algorithm from Talbot et al),
- The colors assigned to every country.
4 of the 16 datasets are used for training: homicide, food, births, and tax.
The descriptions of the datasets as presented to the participants are available in the file descriptions.txt.
Laser Stencils
Download file: exp1-physical.zip
This zip file contains the laser stencils used for creating physical visualizations in our first experiment, in SVG format. For more details on how we built our physical visualizations please see our CHI paper.
Only the homicide dataset is used for training. The food, births, and tax datasets are therefore missing.
Tasks
Download file: exp1-tasks.zip
This zip file contains the tasks used in our 1st experiment.
All files are XML files in the plist format (see http://en.wikipedia.org/wiki/Property_list).
Each plist file contains the 3 tasks that go with a particular dataset (see the dataset file for the datasets). All 3 tasks are of a different type:
The first task consists in estimating a range of values for a given country. In the plist file it is a <dict> element that encapsulates the following data:
- <key>name</key>: The name of the task. In this case, "range"
- <key>question</key>: The question asked
- <key>correct answer</key>: The right answer (min then max value)
The second task consists in ordering all countries from lowest to highest for a given year. In the plist file it is a <dict> element that encapsulates the following data:
- <key>name</key>: The name of the task. In this case, "rank"
- <key>question</key>: The question asked
- <key>answers</key>: The countries to order
- <key>correct answer</key>: The countries in the right order
The third task consists in presenting three {country, year} pairs to the participant and ask/her to determine which one has the lowest value. Each task is a <dict> element in the plist file that encapsulates the following data:
- <key>name</key>: The name of the task. In this case, "choice"
- <key>question</key>: The question asked
- <key>answers</key>: The three possible answers
- <key>correct answer</key>: The right answer
Other elements in the plist file can be ignored.
Please see our CHI'2013 paper for more details.
Instructions
Download file: exp1-instructions.zip
This zip file contains the instruction screens displayed on the touch tablet at the beginning of the 1nd experiment and at each change of technique.
Stereovision Test
Download file: exp1-stereovision-test.zip
This zip file contains the images used for the stereovision test at the beginning of the 1st experiment.
The images are from Hess and Copperstock's online stereo vision acuity test at http://3d.mcgill.ca.
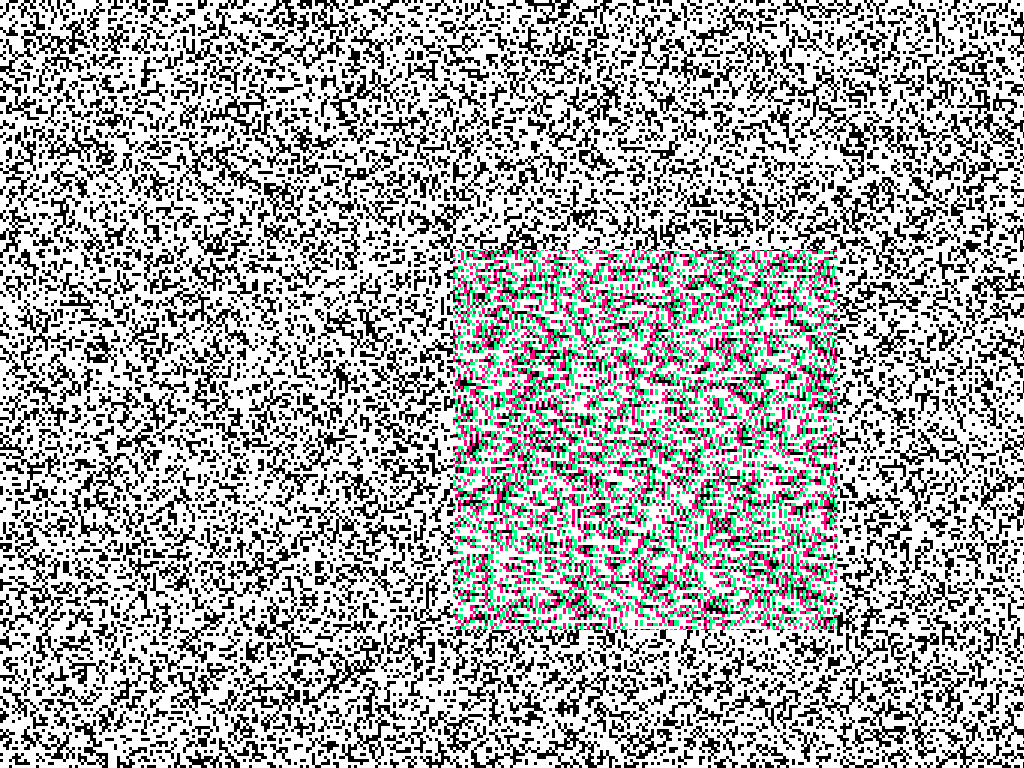
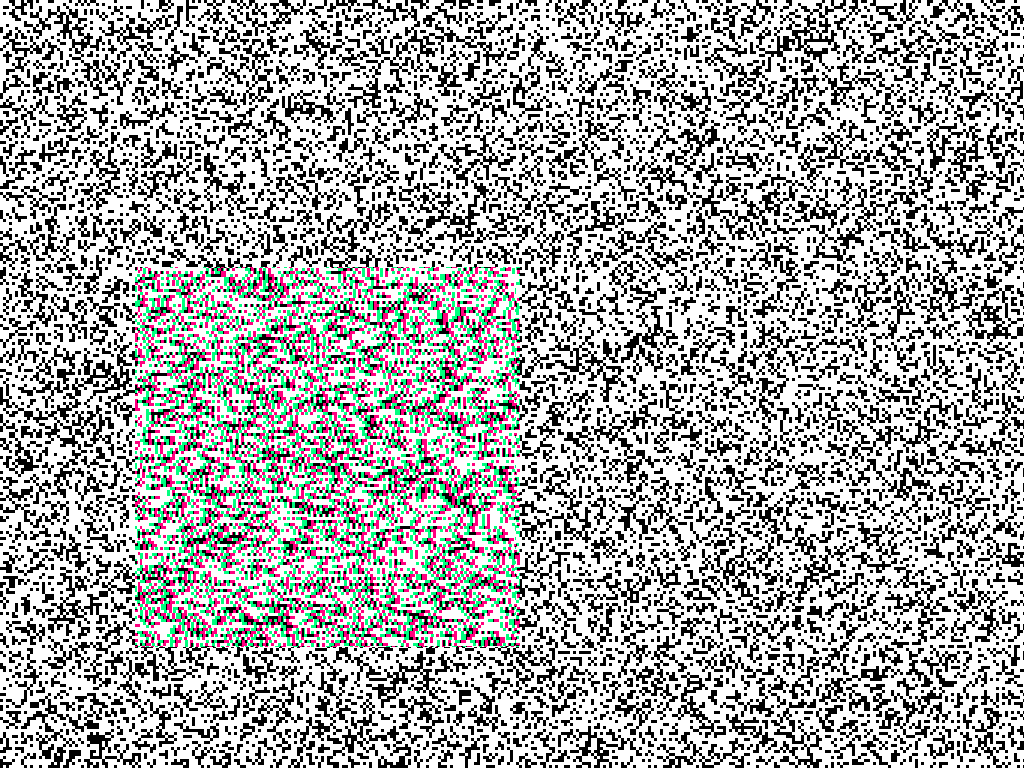
Image pairs were generated from the following anaglyph images:  and
and  .
.
The actual test uses more images and computes the acuity by decreasing stimulus size (stereo disparity). The image file naming convention is:
- fd or bd: in front or behind the screen
- ## (two digits): stereo disparity, from 01 (very small) to 10 (max)
- s#: repetition
The two images we took test stereo acuity half-way between the minimum and maximum values (05).
The procedure for separating image pairs is the following:
- Load the anaglyph in photoshop
- Duplicate the layer
- Hide the top (new) layer, select the background layer
- Open Levels, change min output level from 0 to 255 for Blue and Green layers
- Select the Threshold tool, move the slider between the two peaks, confirm
- Save the image as xxx-left.png
- Show the top layer and select it
- use the Levels tool as above, but for Red and Blue layers
- Use the Threshold tool as above
- Save as xxx-right.png
Experiment 2
Effect Sizes
Results of planned comparisons between techniques, measured as ratios of average time on task with 95% confidence intervals.
| Techniques | Ratio | 95% CI |
|---|---|---|
| touch / no touch | 0.854 | [0.780, 0.935] |
| no touch / prop | 0.873 | [0.801, 0.952] |
| prop / mouse | 0.967 | [0.898, 1.040] |
Participant logs
Download file: exp2-userlogs.zip
This zip file contains:
- The original participant logs of the 2nd experiment in the plist XML format (see http://en.wikipedia.org/wiki/Property_list), one plist file per user
- The file userlogs.csv that combines all logs in a single CSV file for analysis
- The file questionnaire.csv that contains participants' answers to the questionnaire
The columns in userlogs.csv are:
- 1 subject: Subject's number, encoded in the plist file.
- 2 subjectname: Subject's name, extracted from the filename.
- 3 group: The group number, computed by taking subject number (above) modulo 4.
- 4 formerSubject: Indicates whether this subject has participated in the first experiment.
- 5 conditionrank: The rank of the condition (block?) according to the order of the experiment, starting from 1 and ending with 4.
- 6 modality: The modality involved in the condition, defined by a number.
- 7 modalityname: The name of the modality involved in the condition.
- 8 repetition: The repetition number, initialized to 1 when a new condition starts, and incremented with each new dataset presented.
- 9 question: The question number in order of appearance, initialized to 1 when a new repetition starts.
- 10 trial: The global trial number within the experiment (1-32).
- 11 datasetname: The name of the dataset used in this repetition.
- 12 readingTime: The users' time to read the question.
- 13 error: The error in the question's answer, from 0 (exact answer) to 1 (worst possible answer).
- 14 time: Task completion time in seconds, from the press on Start to the last selection or deselection in the list (FIXME).
- 15 perceivedDifficulty: Difficulty rated by the subject, from 1 to 5
- 16 perceivedTime: Task completion time estimated by the subject, in seconds (integer from 0 to 120 in xp2)
- 17 logtime: Task completion time in log of seconds, from the press on Start to the last selection or deselection in the list (FIXME).
Datasets
Download file: exp2-datasets.zip
This zip file contains the datasets of country indicators used in our 2nd experiment.
Each dataset consists in:
1 - A CSV file with the value of the country indicator for each country and year (10 countries and 10 years, 100 values total). The data is from gapminder.org.
2 - A metadata XML file which specifies:
- The full name of the country indicator,
- The min and max axis values (computed using the axis labelling algorithm from Talbot et al),
- The axis tick values (computed using the axis labelling algorithm from Talbot et al),
- The colors assigned to every country.
4 of the 16 datasets are used for training: homicide, food, births, and tax.
Laser Stencils
The physical visualizations used are the same as in our first experiment. Please refer to the Experiment 1 section above.
Tasks
Download file: exp2-tasks.zip
This zip file contains the tasks used in our 2nd experiment.
All files are XML files in the plist format (see http://en.wikipedia.org/wiki/Property_list).
Each plist file contains the 4 tasks that go with a particular dataset (see the dataset folder for the datasets). All 4 tasks are of the same type and consist in presenting three {country, year} pairs to the participant and ask/her to determine which one has the lowest value. Each task is a <dict> element in the plist file that encapsulates the following data:
- <key>question</key>: The question asked
- <key>answers</key>: The three possible answers
- <key>correct answer</key>: The right answer
Other elements in the plist file can be ignored.
Please see our CHI'2013 paper for more details.
Instructions
Download file: exp2-instructions.zip
This zip file contains the instruction screens displayed on the touch tablet at the beginning of the 2nd experiment and at each change of technique.