An Empirical Investigation of Physical Visualizations

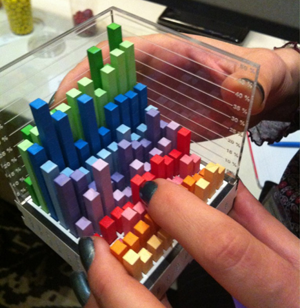
photo taken by Adrian Kuhn at Visweek 2012
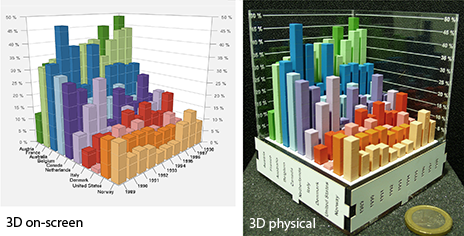
Data sculptures are an increasingly popular form of physical visualization whose purposes are essentially artistic, communicative or educational. But can physical visualizations help carry out actual information visualization tasks? We present the first infovis study comparing physical to on-screen visualizations. We focus on 3D visualizations, as these are common among physical visualizations but known to be problematic on computers. Taking 3D bar charts as an example, we show that moving visualizations to the physical world can improve users’ efficiency at information retrieval tasks. In contrast, augmenting on-screen visualizations with stereoscopic rendering alone or with prop-based manipulation was of limited help. The efficiency of physical visualizations seems to stem from features that are unique to physical objects, such as their ability to be touched and their perfect visual realism. These findings provide empirical motivation for current research on fast digital fabrication and self-reconfiguring materials.
Article

Yvonne Jansen, Pierre Dragicevic, and Jean-Daniel Fekete (2013) Evaluating the Efficiency of Physical Visualizations. Proceedings of the 2013 annual conference on Human factors in computing systems (CHI '13). Pages 2593-2602.  (via ACM)
  (via Inria)
Part of this work has been previously presented as a poster at the Visweek 2012 conference: Yvonne Jansen, Pierre Dragicevic, and Jean-Daniel Fekete (2012) Investigating Physical Visualizations (Poster). IEEE VisWeek 2012 Electronic Conference Proceedings, Oct 2012, Seattle, Washington, USA, United States.
Video
Press
- Interview on the general topic of physical visualizations / data sculptures by Enrico Bertini and Moritz Stefaner from datastori.es.
- Feature on the visual.ly blog by Drew Skau.
Additional Material
Additional material for facilitating the re-analysis, meta-analysis, and replication of our study including:
- Effect sizes with confidence intervals
- Participant logs
- Datasets
- Task questions
- Instructions
Example for a More Interactive Design
Passive physical visualizations can also be interactive. For more, see our recent article on an interaction model for visualizations beyond the desktop.
More Physical Visualizations
We maintain a list of physical visualizations.
License
 | All material on this page is CC-BY-SA. If you reuse or adapt it please reference our article and/or link to this page. |
Contact
- Yvonne Jansen - Université Paris-Sud, INRIA
- Pierre Dragicevic - INRIA
- Jean-Daniel Fekete - INRIA
